HashiCorp Vault sits at the center of your organization's secrets, which makes its audit log some of the most valuable security telemetry you have. With a small set of documented exceptions, Vault audit devices record API requests and responses. Those records can show the requested path, the operation, the result, the source address and, when present, authenticated-principal context. Because unauthenticated requests may not carry identity fields, and Vault applies a keyed HMAC to most string values by default, analysts should not assume that every record exposes a human-readable identity. For teams that have standardized on Microsoft Sentinel, the catch is that HCP Vault Dedicated has no native Sentinel connector, so that telemetry does not automatically reach the place analysts investigate.
You don't need a native connector to close that gap. Vault Dedicated includes a generic HTTP sink that can post audit events to an endpoint you control. A companion Terraform repository stands up the Azure side of that pipeline for you, so the setup is repeatable and far less error-prone than building each resource by hand.
This is an integration pattern, not a one-click connector. The required outcome is to land Vault Dedicated audit logs in Azure Log Analytics. Onboarding the workspace to Sentinel is supported, and Sentinel analytics rules are optional add-ons you can layer on once data is flowing.
In this post, you will learn what the Terraform repo creates, how to deploy it, how to configure the one remaining step in the HCP portal, and how to confirm that audit events land in Log Analytics and Microsoft Sentinel.
»Why stream Vault audit logs to Microsoft Sentinel
A SIEM is most useful when it can correlate. An unusual secret read on its own is hard to judge. The same read next to a suspicious sign-in, an unfamiliar source IP, and an off-hours timestamp may warrant investigation or contribute to an incident. Getting Vault audit events into Sentinel puts them next to the rest of your telemetry so analysts can make that call quickly.
A custom Log Analytics table gives analysts clean, named fields — operation, path, authDisplayName, clientIp — instead of forcing everyone to parse raw JSON in every query. Field values can still be absent, redacted or HMAC-protected according to your Vault audit configuration. And a serverless ingestion endpoint keeps the design easier to run: There's no log forwarder or aggregation tier to patch and scale. keeps the design easier to run: The operational model stays clean — Vault Dedicated remains fully managed, and Sentinel remains your SOC's query surface.
»Architecture
Because Vault Dedicated is fully managed, you don't have host-level access to run a log forwarder alongside Vault. The generic HTTP sink is a supported mechanism for exporting audit events: With JSON encoding selected, it sends each batch as a single JSON array over HTTPS to an endpoint you control. The Terraform repo creates that endpoint and the Azure Monitor ingestion path behind it.
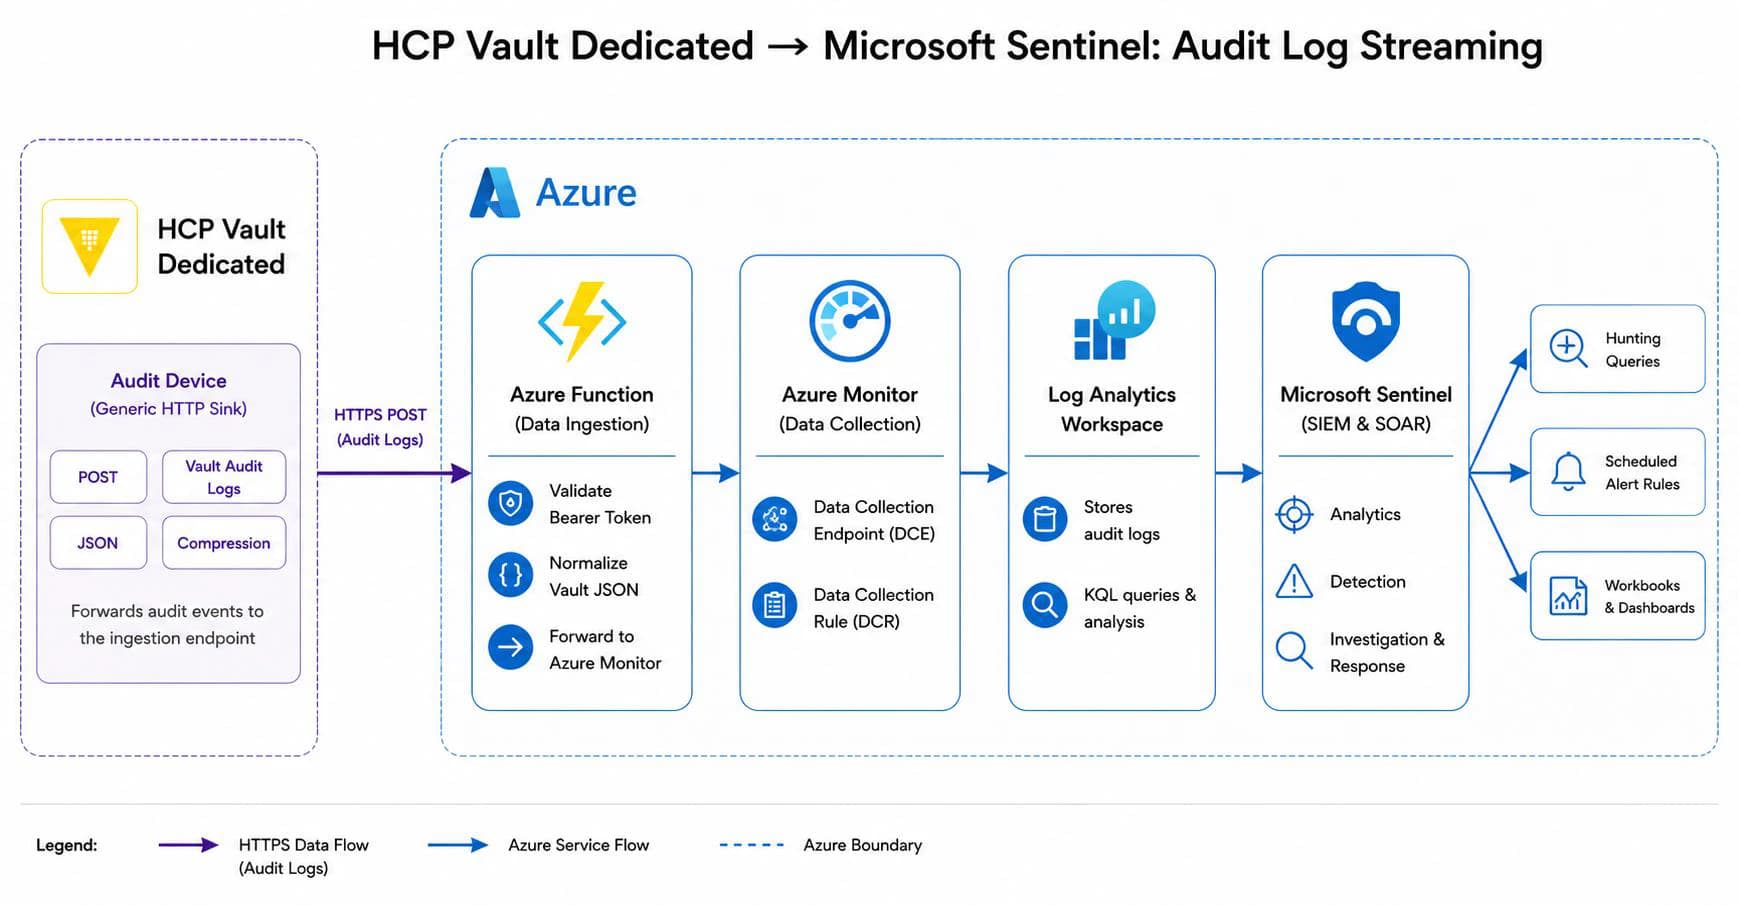
Figure 1. Vault Dedicated → Sentinel: the end-to-end audit log streaming pipeline.
At a high level, the default path is:
HCP Vault Dedicated generic HTTP sink
-> Azure Function App
-> Azure Monitor Logs Ingestion API
-> DCE-backed Data Collection Rule
-> custom Log Analytics table HCPVaultAudit_CL
-> optional Microsoft Sentinel
Here is what happens to a batch of audit events, step by step. The HCP sink posts events as a JSON array, not one object per request — the adapter iterates every event in that array and maps it to a row in the output batch sent to the Logs Ingestion API.
Vault emits an audit event. With a small set of documented endpoint exceptions, Vault audit devices record API requests and responses. With the generic HTTP sink enabled and JSON encoding selected, Vault Dedicated sends audit records in a JSON array over HTTPS to your endpoint, using the credential you configure on the sink.
The endpoint controls ingress. The Function App is the validated default adapter. It uses an Azure Functions HTTP trigger and compares the bearer token supplied by Vault Dedicated before accepting a batch. The Logic App alternative uses a signed callback URL, which must be protected as a secret. Its Request trigger declares an array-shaped schema matching what the HCP JSON sink sends, and its normalization step accepts either an array or a single object.
The endpoint reshapes the batch. The adapter iterates every event in the incoming JSON array — Vault's raw audit JSON is nested and verbose. The adapter flattens each event into a small set of named fields — time, event type, operation, path, identity, client IP, request ID, error, and the original payload — so analysts can query clean columns instead of digging through JSON.
The endpoint forwards to Azure Monitor. It then calls the Azure Monitor Logs Ingestion API. This is the one step the HTTP sink can't do on its own: The API authenticates with any Microsoft Entra identity that holds the Monitoring Metrics Publisher role on the Data Collection Rule — a managed identity is the cleanest way to get one, and is what the adapter uses.
Azure Monitor routes and stores the event. In this repository a data collection endpoint (DCE) is the ingestion endpoint, and the data collection rule (DCR) is explicitly bound to it, so the DCE is required for this deployment. The DCR applies a transform and writes the record into a custom Log Analytics table named HCPVaultAudit_CL. Azure also supports direct-kind DCRs that expose their own public ingestion endpoint, in which case a separate DCE is not required. Note that creating a DCE does not by itself make the deployment Private Link-ready: Azure Monitor Private Link Scope, private endpoints, DNS and network routing are separate requirements.
Sentinel reads the table. If you onboard the workspace to Microsoft Sentinel, the same table becomes available for hunting queries, scheduled analytics rules, incidents, and workbooks. Onboarding and rules are optional — the data lands in Log Analytics either way.
The adapter exists because the Logs Ingestion API authenticates with a managed identity and a DCR, which the generic HTTP sink can't present on its own; the adapter bridges that gap and normalizes the event in the same place. The custom table exists because named columns keep KQL simple and detection rules maintainable, instead of forcing every query to parse raw JSON.
Default and fallback endpoints. The default endpoint is an Azure Function App (Python, on a Consumption plan). If your subscription can't create an App Service plan because of App Service worker quota (this surfaces in the Azure portal's Usage + quotas page under the Microsoft.Web provider — look for Total VMs or Dynamic VMs depending on your plan type), set ingestion_endpoint_type = "logic_app" and Terraform creates an Azure Logic Apps Consumption workflow instead. The Logic App uses a signed callback URL for ingress rather than a bearer token, and its managed identity posts to the same DCR stream. Both paths write to the same DCR and table, but they are not identical in behavior: the Function App batches normalized rows into a single Logs Ingestion API call, while the Logic App iterates the batch and posts one row per call.
Network assumption. This deployment assumes your Vault Dedicated cluster can reach the Terraform-created Azure ingestion endpoint over HTTPS. In production, the cluster may be private or subject to egress controls. Terraform creates the Azure ingestion endpoint, but it does not create the network path from your Vault Dedicated cluster to Azure. You are responsible for any routing, firewall, proxy, allowlist, or private-connectivity requirements that let the generic HTTP sink reach the endpoint. If that path doesn't exist, logs won't flow no matter how the Azure side is configured.
»What the Terraform repo creates
Running the companion repo provisions the Azure side end to end:
A resource group and a Log Analytics workspace
A custom table, HCPVaultAudit_CL, with a flat, query-friendly schema
A Data Collection Endpoint and a DCE-backed Data Collection Rule with the transform that maps incoming events to the table
An ingestion endpoint — an Azure Function App (default) or an Azure Logic Apps Consumption workflow (fallback) — with a system-assigned managed identity that holds Monitoring Metrics Publisher on the DCR
The shared secret for the endpoint: a generated bearer token for the Function App path, or a signed callback URL for the Logic App path
Optionally, onboarding the workspace to Microsoft Sentinel, and a set of starter scheduled analytics rules
Helper scripts in the repo configure variables, publish the Function App code, and run a smoke test, so you can go from clone to flowing logs without hand-assembling resources.
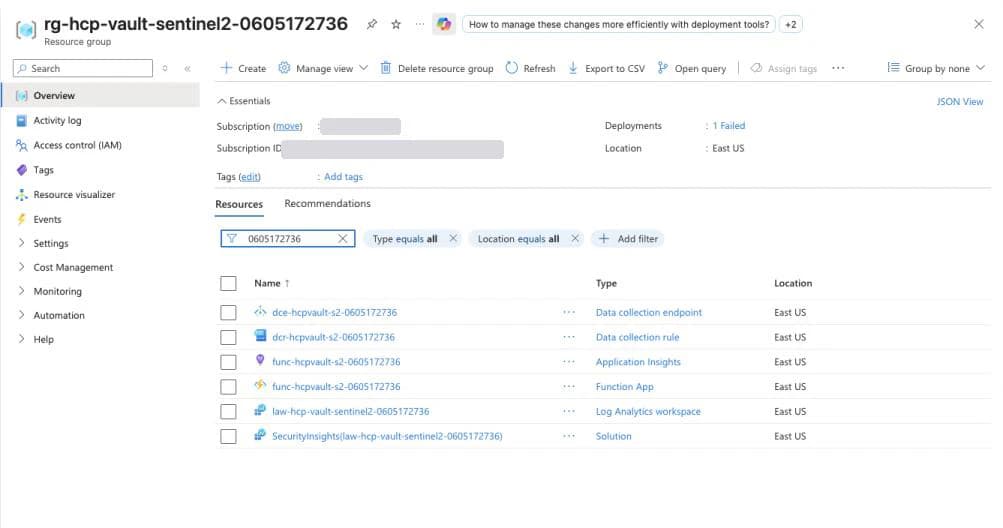
Figure 2. The resource group after a default Function App deployment. Terraform creates the ingestion endpoint, Log Analytics workspace, DCE, DCR, and optional Microsoft Sentinel onboarding. Subscription details are redacted here.
»What you need before you start
A Vault Dedicated cluster on the Essentials or Standard tier. Audit log streaming isn't available on the Development tier.
An HCP account with the Admin role, which is required to configure audit log streaming for the cluster.
An Azure subscription with permission to create the Terraform-managed resources listed above, including role assignments and (optionally) Sentinel onboarding. Contributor alone is not enough — Terraform creates a role assignment for the ingestion endpoint's managed identity, which needs User Access Administrator or Owner on the subscription.
A confirmed network path from your Vault Dedicated cluster to the Terraform-created Azure ingestion endpoint over HTTPS.
Terraform and the Azure CLI, in Azure Cloud Shell or installed locally.
Azure Functions Core Tools v4 if you're deploying the Function App endpoint. Cloud Shell images change over time, so run func --version first and install Core Tools if the command is unavailable; the publish script calls func directly and fails with "func: command not found" without it.
One portal note: Sentinel is generally available in the Microsoft Defender portal, and Microsoft has stated that Sentinel in the Azure portal will be retired on March 31, 2027. Menu labels and investigation workflows differ between the two portals, so plan the transition now. The underlying resources and KQL are the same.
HVD Audit Logs note: Vault Dedicated streams audit logs to one endpoint at a time. Review your existing audit log streaming destination before enabling this one, especially if you already export Vault audit logs to another SIEM or logging pipeline.
»Deploy the Azure ingestion pipeline with Terraform
Clone the companion repo:
git clone https://github.com/abhijeetvlokhande/hvd-sentinel-integration.git
cd hvd-sentinel-integration
Sign in to Azure and select the target subscription:
az login
az account set --subscription "<YOUR_SUBSCRIPTION_ID_OR_NAME>"
Register the Azure resource providers this deployment needs (one time per subscription). Terraform also registers these providers itself when register_resource_providers is left at its default, so treat the preflight script as the explicit route that surfaces registration errors before apply starts:
# Default (Function App deployment)
./scripts/preflight.sh "<YOUR_SUBSCRIPTION_ID>"
# With Sentinel onboarding
./scripts/preflight.sh "<YOUR_SUBSCRIPTION_ID>" --sentinel
# With Logic App
./scripts/preflight.sh "<YOUR_SUBSCRIPTION_ID>" --logic-app
# Both
./scripts/preflight.sh "<YOUR_SUBSCRIPTION_ID>" --sentinel --logic-app
Create your local Terraform variables with the helper script:
./scripts/configure-terraform.sh
The helper prompts for the values that shape the deployment:
Azure subscription ID
Azure tenant ID
Azure region
Resource prefix and environment suffix
Ingestion endpoint type: function_app or logic_app
Log Analytics retention in days
Whether to onboard the workspace to Sentinel
Whether to create starter Sentinel analytics rules
A few choices to make up front:
Choose function_app for the default deployment.
Choose logic_app if your subscription can't create an App Service plan because of App Service worker quota.
For the smallest working pipeline, leave create_sentinel_rules = false. You can add rules later.
The generated terraform/terraform.tfvars is ignored by Git, so your inputs stay out of version control.
Deploy:
terraform -chdir=terraform init
terraform -chdir=terraform apply
»Publish or activate the ingestion endpoint
If you selected the default Function App endpoint, publish the function code:
./scripts/publish-function.sh
If you selected logic_app, the publish script exits without doing anything — the Logic App workflow is fully created by Terraform, so there's no separate code to deploy.
Run the smoke test to confirm the Azure side accepts events before you involve Vault:
./scripts/smoke-test.sh
How to read the result:
The Function App path returns HTTP 200 when the event is accepted.
The Logic App path returns HTTP 202 when the request trigger accepts the request. The smoke test posts a JSON array, the same shape HCP sends with JSON encoding, so it exercises the real payload on both endpoint types.
Note: For the Logic App path, after the smoke test returns 202, open the Logic App in the Azure portal and check Workflow run history to confirm the run succeeded end to end. A 202 means the trigger accepted the request — it does not guarantee the downstream DCR ingestion call completed. The run history shows each action's status and lets you inspect the exact request and response for post_to_dcr.
401 usually means a bearer token mismatch on the Function App path.
A 403 or managed-identity authorization error usually means the DCR role assignment hasn't propagated yet. Azure RBAC changes can take up to 30 minutes to take full effect on the data plane. Wait and retry. Restarting the endpoint may refresh a cached token, but it does not accelerate RBAC propagation.
Azure documents an average of under 10 seconds between data reaching a collection endpoint and being queryable, but explicitly excludes custom applications that use the Logs Ingestion API from that measurement. End-to-end time here also includes the HCP sink, the network, the adapter and the DCR transform, so allow several minutes when validating. The first event into a brand-new custom table is a further exception: Azure provisions a dedicated storage container the first time a new data type appears, which can take several minutes. This is a one-time delay.
Read the values you'll paste into HCP from the Terraform outputs. Every deployment needs hcp_sink_url:
terraform -chdir=terraform output -raw hcp_sink_url
Only the Function App path uses a bearer token. If you deployed function_app, also read it:
terraform -chdir=terraform output -raw hcp_bearer_token
The Logic App path doesn't use a bearer token in HCP — its authorization is carried in the signed hcp_sink_url. Treat the Function App bearer token, the Logic App signed callback URL, and any Terraform state that contains them as secrets. The bearer token is the credential on the Function App path; a plain Function App endpoint URL is not itself the secret.
»Configure HCP Vault Dedicated audit log streaming
This is the one step that lives outside Terraform. In the HCP portal, open your Vault Dedicated cluster and configure audit log streaming:
Audit logs → Enable log streaming → Generic HTTP Sink
URI: the Terraform hcp_sink_url output
Method: POST
Encoding: JSON. Select JSON rather than NDJSON — the adapter parses a JSON array.
Compression: disabled. Leave gzip compression off for this pipeline, not only for the first validation: the adapter expects an uncompressed JSON body.
The authentication settings depend on which endpoint type you deployed.
For ingestion_endpoint_type = "function_app":
Strategy: Bearer
Token: the Terraform hcp_bearer_token output
For ingestion_endpoint_type = "logic_app":
The hcp_sink_url output is already a signed Logic App callback URL. Use it as the URL, and leave Strategy blank — the Strategy field is optional, so no authentication strategy is required.
Do not configure a bearer token or a separate authorization header for this path. The signature in the URL is what authorizes the request.
Save the configuration. It may take up to 20 minutes for the change to take effect.
»Validate ingestion in Log Analytics
Validation here is about one thing: confirming events land in the custom table. Open Logs on the workspace and run the query below.
Validation queries should return rows when ingestion is working. Detection queries may return zero rows if the matching behavior hasn't occurred — that is expected.
HCPVaultAudit_CL
| where TimeGenerated > ago(24h)
| summarize Events = count() by path
| order by Events desc
| take 20
If this returns rows, the pipeline works end to end: the sink is reaching your endpoint, the endpoint is authenticating to Azure Monitor, and the DCR is writing to HCPVaultAudit_CL.
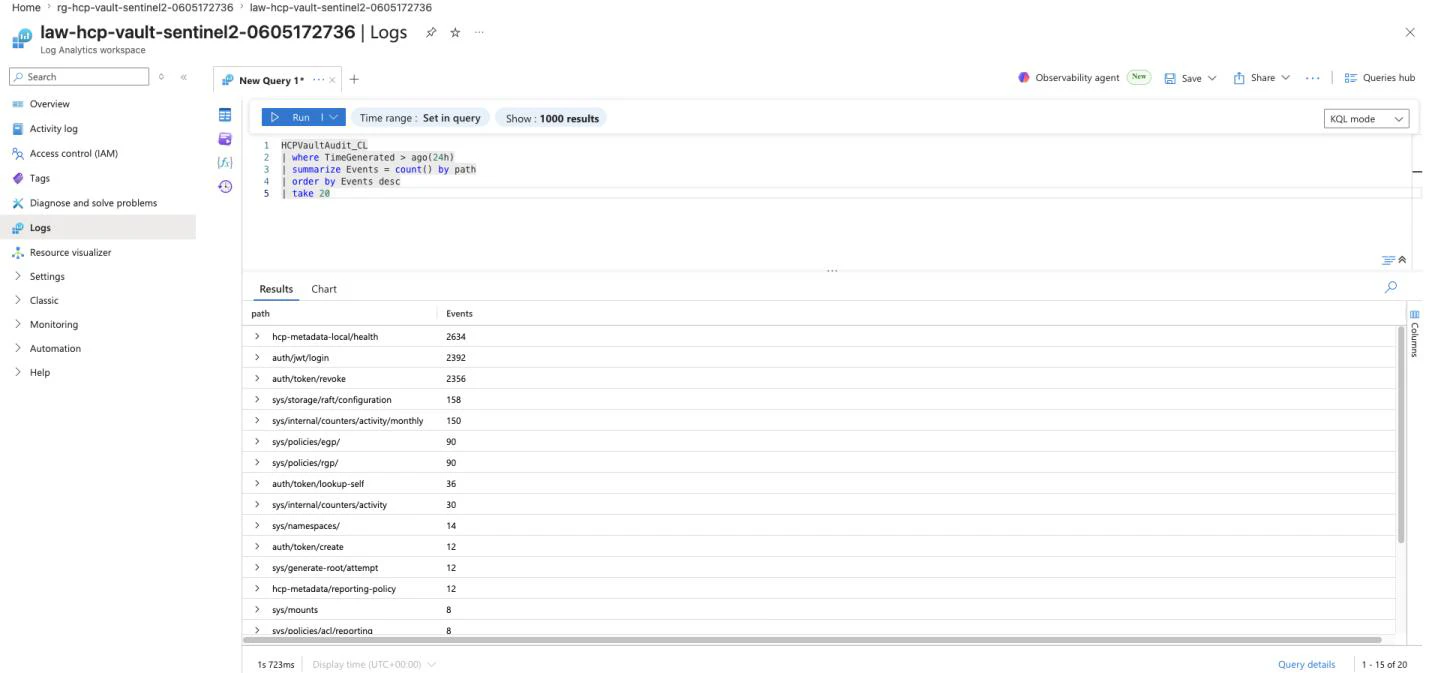
Figure 3. A validation query in Log Analytics: Vault audit events landing in the custom table, grouped by path, with clean parsed fields.
»Beyond ingestion: parsing rawData for security use cases
The pipeline normalizes a baseline set of Vault audit fields into dedicated table columns — eventTime, eventType, operation, path, authDisplayName, clientIp, requestId, errorMessage — and preserves the complete received Vault audit event in the rawData column. These baseline columns are enough to confirm ingestion and run the detection examples below.
If your Sentinel team needs additional fields for deeper security use cases, the full Vault audit payload is already in rawData and can be extracted at query time using KQL. No changes to the Function App, DCR, or table schema are needed.
Run this first — discover what fields exist in your workspace:
HCPVaultAudit_CL
| getschema
| project ColumnName, ColumnType
| order by ColumnName asc
Discover top-level fields inside rawData:
HCPVaultAudit_CL
| where TimeGenerated > ago(7d)
| where isnotempty(rawData)
| extend raw = parse_json(rawData)
| extend FieldNames = bag_keys(raw)
| mv-expand FieldName = FieldNames to typeof(string)
| summarize EventCount = count() by FieldName
| order by FieldName asc
Run the same pattern replacing bag_keys(raw) with bag_keys(raw.auth), bag_keys(raw.request), and bag_keys(raw.response) to discover nested fields.
Starter parser — extract commonly useful fields at query time:
HCPVaultAudit_CL
| where TimeGenerated > ago(24h)
| where isnotempty(rawData)
| extend raw = parse_json(rawData)
| extend
VaultEventTime = todatetime(iff(isempty(tostring(raw["time"])), tostring(eventTime), tostring(raw["time"]))),
VaultEventType = iff(isempty(tostring(raw["type"])), tostring(eventType), tostring(raw["type"])),
Operation = iff(isempty(tostring(raw.request.operation)), tostring(operation), tostring(raw.request.operation)),
Path = iff(isempty(tostring(raw.request.path)), tostring(path), tostring(raw.request.path)),
RequestId = iff(isempty(tostring(raw.request.id)), tostring(requestId), tostring(raw.request.id)),
ClientIp = iff(isempty(tostring(raw.request.remote_address)), tostring(clientIp), tostring(raw.request.remote_address)),
AuthDisplayName= iff(isempty(tostring(raw.auth.display_name)), tostring(authDisplayName), tostring(raw.auth.display_name)),
AuthEntityId = tostring(raw.auth.entity_id),
AuthPolicies = tostring(raw.auth.policies),
AuthTokenPolicies = tostring(raw.auth.token_policies),
MountType = tostring(raw.request.mount_type),
Namespace = tostring(raw.request.namespace.path),
ErrorMessage = iff(isempty(tostring(raw.error)), tostring(errorMessage), tostring(raw.error)),
ClusterId = tostring(raw.cluster_id),
OrganizationId = tostring(raw.organization_id),
ProjectId = tostring(raw.project_id),
Region = tostring(raw.region)
| extend HasError = isnotempty(ErrorMessage)
| project
TimeGenerated, VaultEventTime, VaultEventType, Operation, Path,
RequestId, ClientIp, AuthDisplayName, AuthEntityId, AuthPolicies,
AuthTokenPolicies, MountType, Namespace, HasError, ErrorMessage,
ClusterId, OrganizationId, ProjectId, Region, rawData
| order by TimeGenerated desc
This parser does not modify the table schema — it only extracts fields at query time. You can save it as a Log Analytics function and reference it by name in analytics rules and hunting queries.
Two notes on field values:
Vault Dedicated log streaming adds HCP-specific metadata fields alongside the Vault audit event — cluster_id, organization_id, project_id, provider, region. These are not part of the standard Vault audit schema and are specific to the managed service. The adapter preserves them inside rawData but does not promote them into dedicated table columns, so extract them at query time as shown above.
Vault intentionally HMACs or redacts certain sensitive values by design — for example, token values and some response data fields. These fields will appear as hash strings rather than plaintext. This is expected Vault security behavior, not a pipeline issue.
When to extend the schema:
If specific fields are queried frequently enough that parse_json() at query time becomes a performance concern, the next step is to promote those fields into dedicated table columns by updating the Function App normalization, DCR stream declaration, and table schema. Do that only after your team has confirmed which fields your specific use cases require.
»Optional: Sentinel analytics rules
Onboarding to Sentinel and creating analytics rules are optional. Ingestion into Log Analytics works without either. When you're ready to add SOC workflows, set the following in your Terraform variables:
sentinel_enabled = true
create_sentinel_rules = true
sentinel_enabled = true onboards the Log Analytics workspace to Microsoft Sentinel. create_sentinel_rules = true creates the starter scheduled analytics rules included in the repo. Re-run terraform -chdir=terraform apply to make the change. In the companion repo, sentinel_enabled already defaults to true and create_sentinel_rules defaults to false, so the rules are the opt-in step.
The starter rules are built from the KQL patterns below. Use them as starting points and tune the thresholds and windows to your environment.
The examples below use explicit TimeGenerated filters so you can run them interactively in Log Analytics as hunting queries. A deployed scheduled rule also scopes its evaluation with the rule's queryPeriod, but Sentinel does not rewrite the literal ago() expression in the query body — the effective window is the narrower of the two, so keep them aligned. The filters below match the repository's configured queryPeriod values: 1 hour for authentication activity, 2 hours for secret enumeration and sensitive path access, and 24 hours for off-hours activity.
Authentication-path activity — counts requests under auth/ paths. This is an activity-volume signal rather than a failed-login or brute-force detector; add error conditions and tune the path filter for the authentication methods you use.
let Window = 5m;
let MinAttempts = 10;
HCPVaultAudit_CL
| where TimeGenerated > ago(1h)
| where path startswith "auth/"
| summarize Attempts = count()
by authDisplayName = coalesce(authDisplayName, "unknown"),
path,
bin(TimeGenerated, Window)
| where Attempts >= MinAttempts
| order by Attempts desc
Secret enumeration — flags one identity reading many distinct secret paths in a short window. The example assumes KV v2 mounts named kv/ or secret/; change the path prefixes for your actual mounts and namespaces.
let Window = 10m;
let MinDistinctPaths = 3;
HCPVaultAudit_CL
| where TimeGenerated > ago(2h)
| where operation == "read"
| where path startswith "kv/data/" or path startswith "secret/data/"
| summarize DistinctPaths = dcount(path),
TotalReads = count()
by authDisplayName = coalesce(authDisplayName, "unknown"),
bin(TimeGenerated, Window)
| where DistinctPaths >= MinDistinctPaths
| order by DistinctPaths desc
Sensitive path access — reviews selected operations against a defined set of high-value paths.
let SensitivePaths = dynamic([
"auth/token/create",
"kv/data/prod/db",
"kv/data/prod/root",
"auth/jwt/login",
"auth/token/revoke",
"sys/generate-root/attempt"
]);
HCPVaultAudit_CL
| where TimeGenerated > ago(2h)
| where operation in ("read", "create", "update", "patch", "delete", "list")
| where path in (SensitivePaths)
| project TimeGenerated, authDisplayName, operation, path, clientIp, requestId
| order by TimeGenerated desc
Vault records request.operation as create, read, update, patch, delete, or list. "write" is not an audit operation value, so an operation filter that includes it matches nothing on that term while list and patch go unmatched — which means a list against a sensitive path would not alert.
Off-hours Vault activity — surfaces all matching Vault audit activity outside the configured UTC hours — not only secret access. Narrow the paths or operations if the intended detection is specifically secret access.
let StartHourUtc = 6;
let EndHourUtc = 18;
HCPVaultAudit_CL
| where TimeGenerated > ago(24h)
| extend HourUTC = datetime_part("hour", TimeGenerated)
| where HourUTC < StartHourUtc or HourUTC >= EndHourUtc
| summarize Events = count()
by authDisplayName = coalesce(authDisplayName, "unknown"),
path,
operation,
HourUTC,
bin(TimeGenerated, 1h)
| order by TimeGenerated desc
Secret enumeration and off-hours activity are behavior-dependent. If your environment hasn't generated multi-path secret reads or off-hours access, those queries may return no rows. That is a correct result, not a pipeline failure.
The repo's starter rules apply sensible defaults: They run on a 30-minute to 6-hour schedule over a 1–24 hour lookback depending on the detection, trigger when the query returns more than zero rows, and create incidents. As shipped, authentication activity is medium severity mapped to Credential Access, secret enumeration is medium with Discovery, sensitive path access is high with Credential Access, and off-hours activity is low with Collection. Each rule enables suppression, so the same activity does not re-alert on every run, and maps authDisplayName to an account entity — with clientIp mapped as an IP entity on the rules whose queries carry it — so incidents arrive with something to pivot on. Each suppression window is set no longer than the rule's own lookback, so a rule that resumes still queries across the interval it sat out; the cost is delayed notification rather than missed activity. Tune the durations, frequencies and thresholds to your own tolerance before production use.
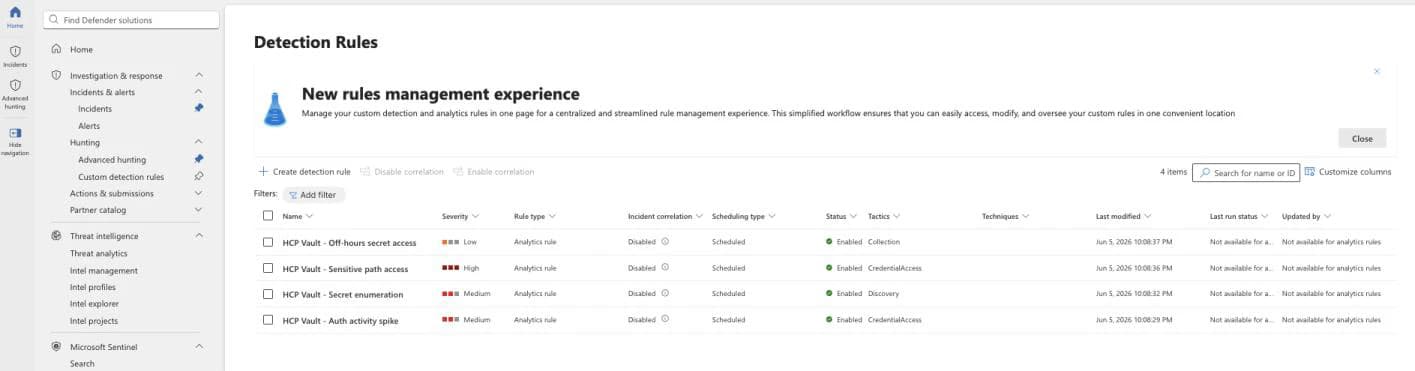
Figure 4. The repo's optional starter rules, enabled in the Microsoft Defender portal. They turn Vault audit activity into SOC alerts and incidents — but they aren't required for ingestion.
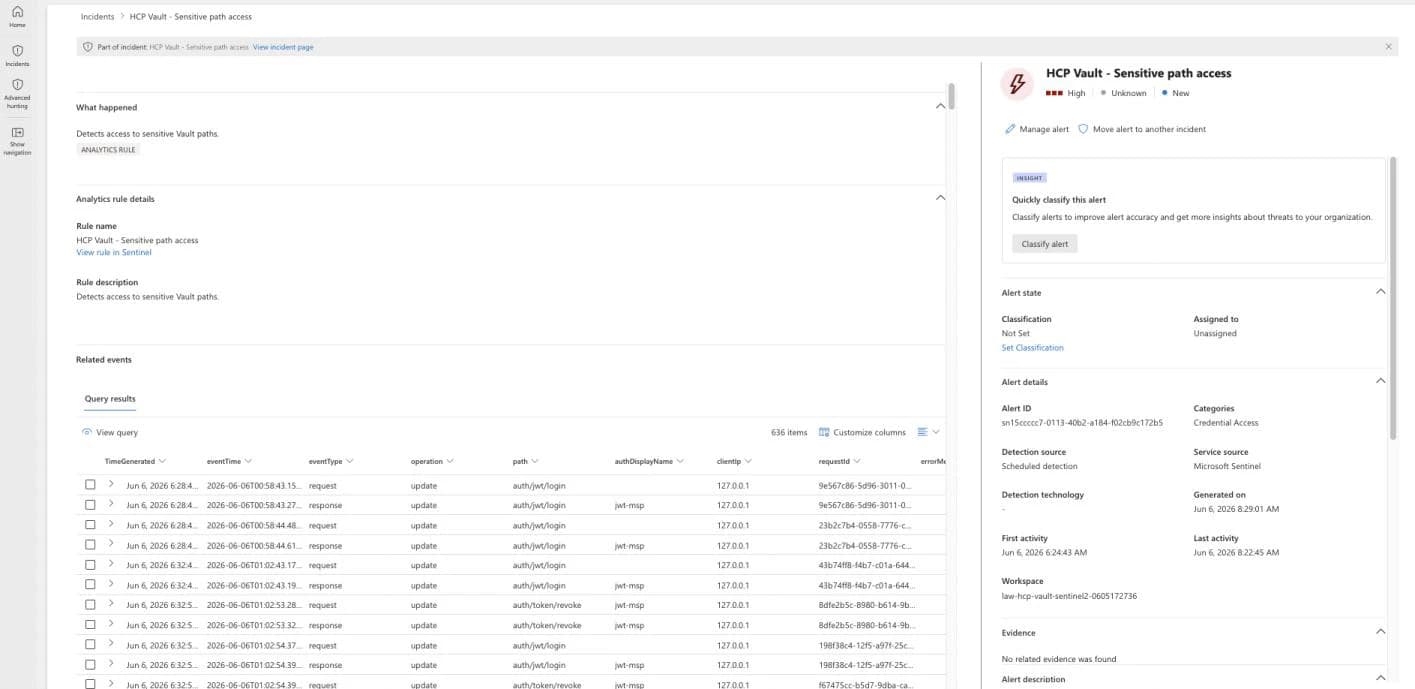
Figure 5. When a rule matches, it generates an alert and incident for investigation. Starter rules map authDisplayName to an account entity and, when available, clientIp to an IP entity, giving analysts context to pivot and investigate.
»Operating and security considerations
A few things to keep in mind once this is running:
Protect your Terraform state. State can contain sensitive values such as the generated bearer token and the signed Logic App callback URL. Store state in a secured backend, and restrict access.
Source the token securely for production. Consider supplying hcp_bearer_token from a secret manager rather than letting it be generated and stored in state.
Keep secrets out of sight. Don't screenshot or share Function App settings, Terraform state, bearer tokens, or signed Logic App callback URLs.
Least-privilege identity. The Function App or Logic App managed identity needs only Monitoring Metrics Publisher on the DCR.
Outbound connectivity is on you. Vault Dedicated makes outbound HTTPS calls to the configured endpoint. A private or egress-restricted cluster needs an approved network path to the Azure ingestion endpoint before streaming can work.
One destination at a time. The generic HTTP sink streams to a single endpoint, so this pipeline uses that slot.
Change the schema carefully. DCR and table schema changes affect ingestion and can break existing analytics content, so manage them as a reviewed change.
Mind cost and latency. Log Analytics ingestion and retention, plus endpoint execution, are usage-based. Azure documents sub-10-second processing after data reaches a collection endpoint, but excludes Logs Ingestion API applications from that figure, so measure your own end-to-end latency and expect a longer first record for a newly created custom data type. Set per-table retention to match your data governance.
»Cleanup
Remove the destination in the HCP portal first so the cluster stops posting to an endpoint that is about to disappear: open the cluster's Audit Logs and disable the generic HTTP sink. Then tear down the Azure resources:
terraform -chdir=terraform destroy
For more information, visit: