
Migrating to the cloud was supposed to make infrastructure easier to provision and manage. For many enterprises, the reality has become much more complicated. New pain points emerged that undermine the cloud’s speed, security, and scale.
Take the “normal” state for organizations now: infrastructure data stored in silos. As a result, rarely is there a unified picture of what's happening across hybrid and multi-cloud environments. Instead, platform teams cobble it together themselves — or end up buying different tools to help, creating even more sprawl. They struggle to track who owns and is responsible for different resources. Security patching and risk mitigation get harder, complexity grows, and costs escalate.
This is where HCP Terraform powered by Infragraph helps.
»Infragraph now in limited availability
We’re excited to announce that HCP Terraform powered by Infragraph is now available to current HCP Terraform Standard and Premium customers using HCP Terraform in US instances. With the move to limited availability, the Infragraph connector ecosystem is increasing to include Microsoft Azure, GitHub, and Terraform Enterprise with more to come in the future. Additionally, users will see updates to the graph explorer and query builder, giving them better visibility and tools to gain insights into their data. All of this, along with continued improvements around UX, usability, onboarding, and user role assignments are launching in this release.
In this limited availability release, eligible teams can explore their cloud infrastructure through a live, connected view of resources, relationships, and state to help them better understand ownership, identify issues, and take action faster. This gives teams a powerful new way to explore, understand, and act on their cloud infrastructure.
»Recap: connectors and what’s available
Infragraph connects directly to your cloud and infrastructure sources to map out relationships and surface insights. Today, you can leverage connectors across environments like AWS and Azure, bringing together infrastructure, configuration, and state data into a unified graph view.
With these connectors, you’re able to go beyond static inventories to being able to understand how resources relate, where risk lives, and what requires action.
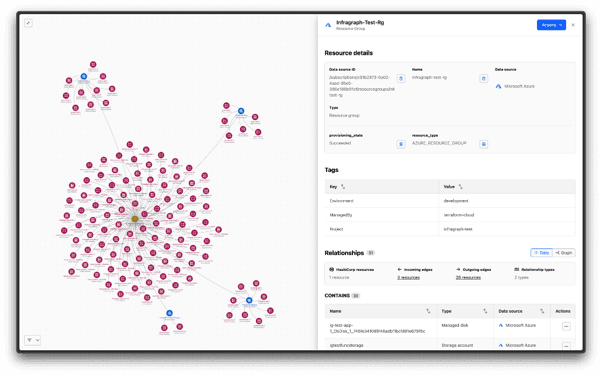
See all managed volumes, mapped through their VMs and VPCs
With this in mind, here are some quick ways to start deriving value from Infragraph.
»Queries our customers are using today
Infragraph uses a query interface to allow users to view and search through their data. It enables users to build queries to gain insights about their infrastructure estate through low code and JSON queries with future support for NL2Q.
Teams are already using Infragraph queries to answer critical operational questions in seconds. For example, below see all the Git commits that starts with the keyword COMPLIANCE and their associated Git branch, repository and organization.
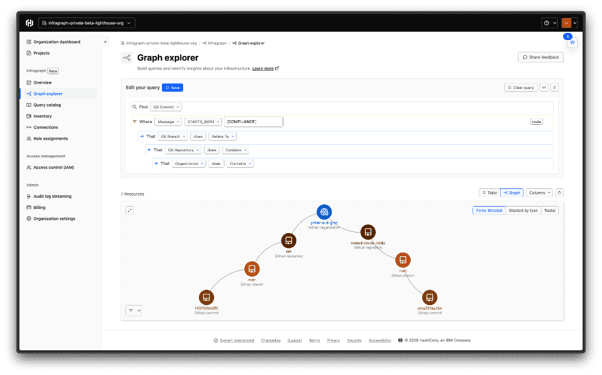
Graph Query Example
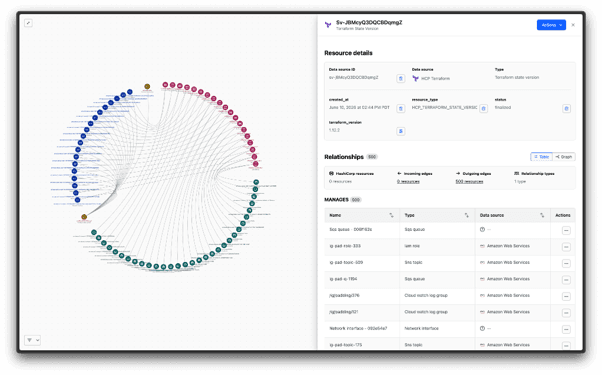
View AWS/Azure resources connected to the same .tfstate
Understand how infrastructure managed by Terraform is linked, making it easier to assess blast radius and dependencies.
View TF state file managed VMs (or resource groups) across AWS and Azure (the blue nodes and the red nodes clusters around them are Azure resources; and the red nodes clustered around the brown TF state file node are the AWS resources)
View security rules and regions of EC2 instances
Quickly audit configurations, identify exposure risks, and ensure resources are deployed in expected regions.See what’s not under management
Surface unmanaged or orphaned resources to improve governance and reduce unexpected costs.
These queries turn complex infrastructure data into actionable insights for platform team leaders and engineers, DevOps and SecOps teams, and beyond — no manual stitching required. Now with the right, unified data and context, teams can put their energy into mission-critical updates as opposed to wasting cycle collecting and verifying data from varied sources that quickly goes out of date.
»Share these queries with your team
Insights are most powerful when they’re shared. Infragraph makes it easy to operationalize queries across your team:
Step 1 – Add your team
Invite teammates to Infragraph as contributors or viewers so they can collaborate on insights.
Step 2 – Create and save a query
Build a query tailored to your use case and save it to your query catalog.
Step 3 – Share for action
Link the saved query directly with teammates so they can investigate and take action.
Step 4 – Revisit and stay up to date
Queries stay live — revisit them anytime to see how your environment is evolving.
The best way to begin getting value is by exploring Infragraph saved queries and adding your team today!
»Get started
Start turning infrastructure visibility into action. Learn more about how to get started with Infragraph today!