Whether using HashiCorp Terraform providers and modules or publishing them, we all use download counts as one factor in determining the overall health and popularity of a provider or module.
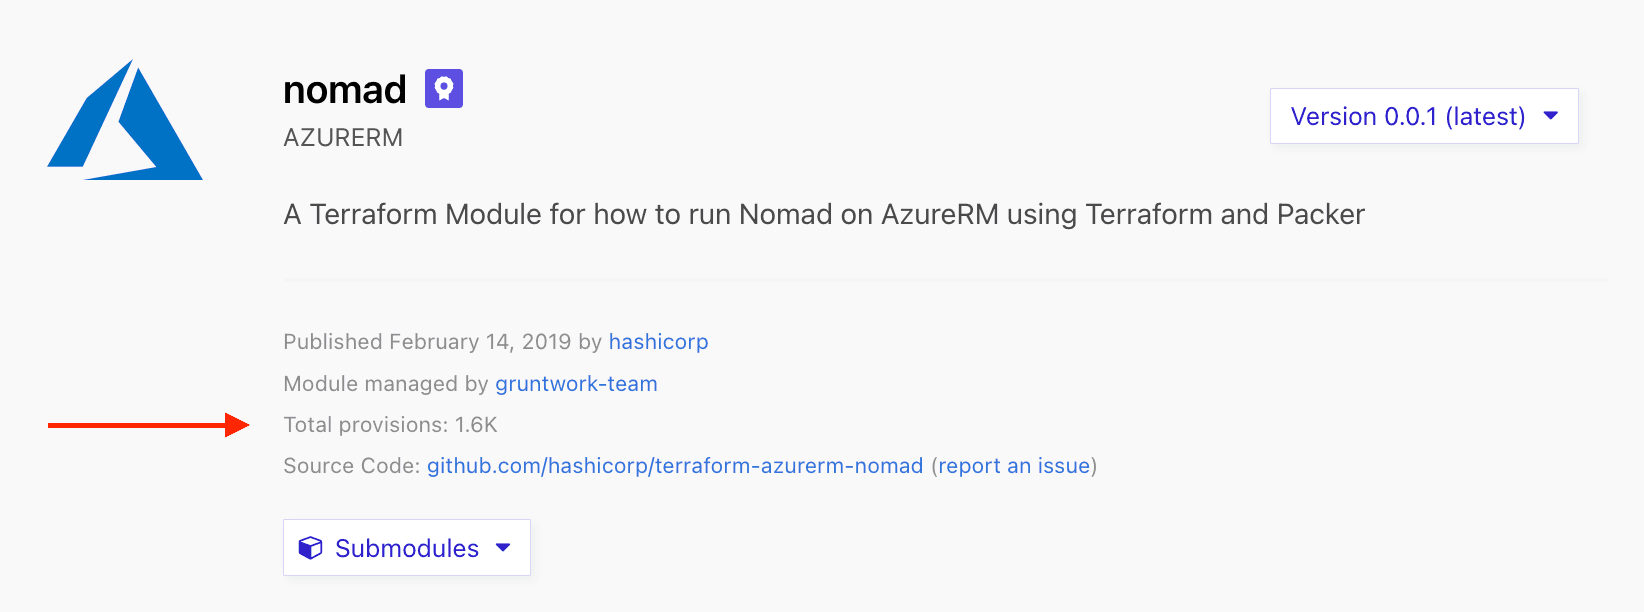
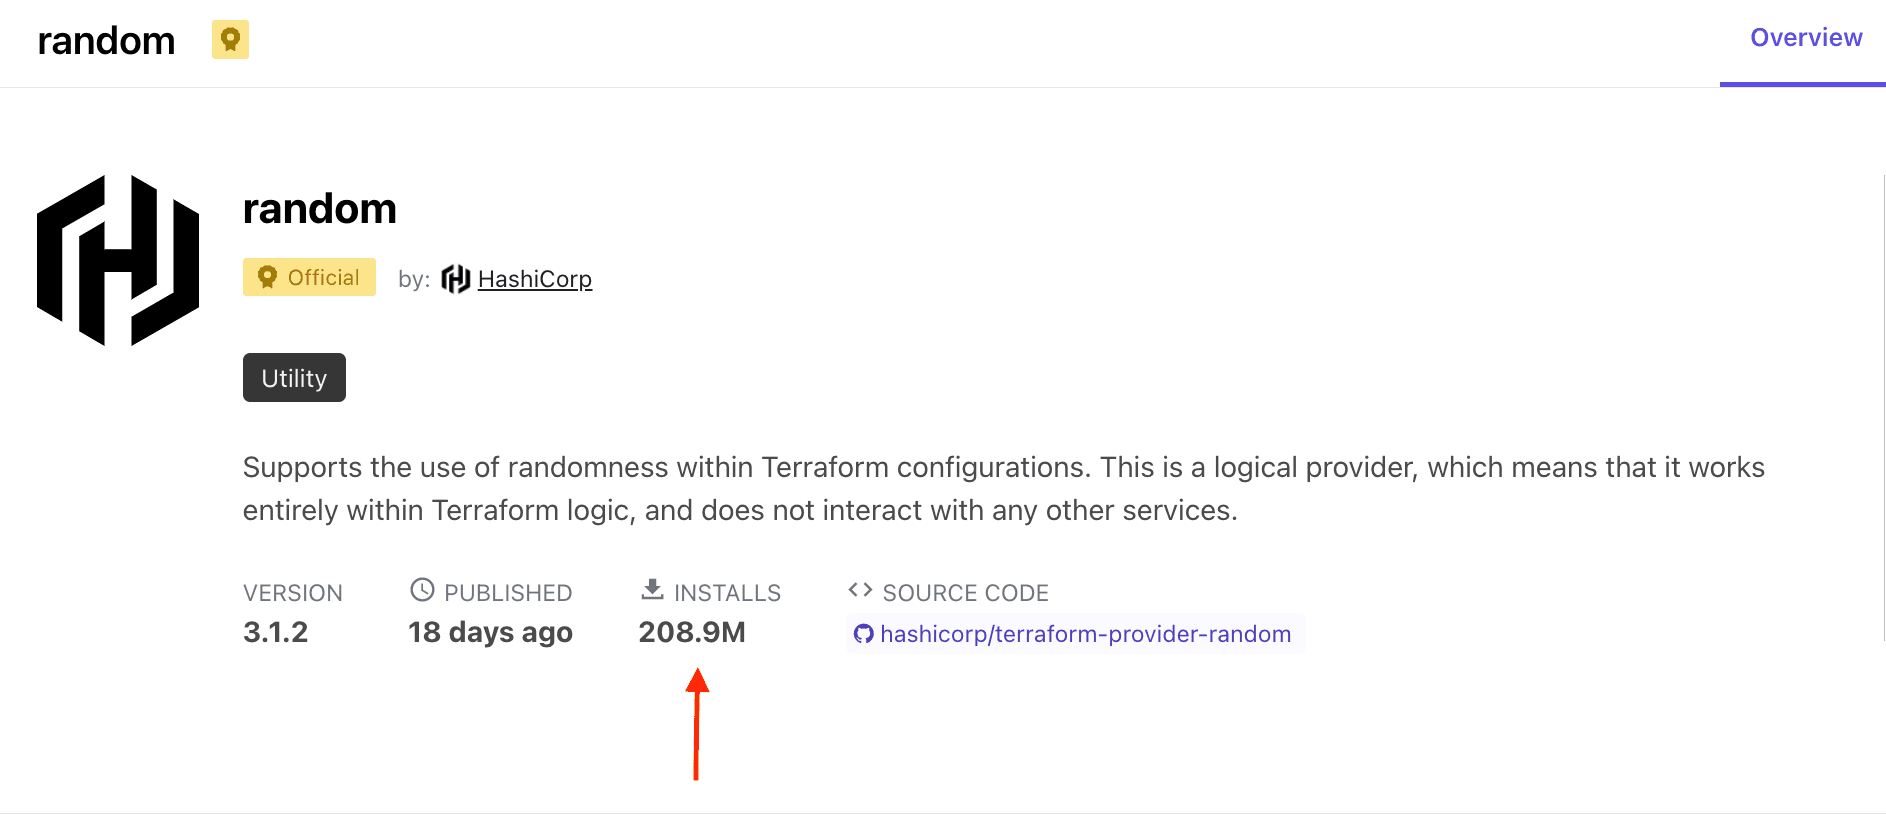
The HashiCorp public Terraform Registry previously displayed a single, rounded-up number alongside other metadata about a module or provider on its landing page. As our community and tech partners publish more modules and providers, however, we wanted to be more intentional about how the usage was counted. And we wanted to surface more details about that usage, so contributors can do their own analysis on the health and performance of their modules and providers.
We've recently released a new display of download count metrics in both the public and private Terraform registries. To celebrate, we thought we'd show you what the new metrics presentation looks like, and walk you through some of the changes in how these numbers are calculated and displayed.
»User Experience Improvements
Instead of a single "total provisions" count, the landing pages now show a broader range of information for how many times a module or provider has been used.
The public and private registries look very similar, so any user assessing a module or provider gets the same experience. We decided to update the old rounding scheme, which showed count totals like "1.6k," and instead display numbers to the first whole integer for counts of fewer than one million. As shown in the screenshot below, instead of a single number, you will now see four numbers:
Downloads this week
Downloads this month
Downloads this year
Downloads all time


By default, this will be calculated for all versions. However, a dropdown selector lets you choose to see only the numbers for the version whose page you are currently on. If you'd like to see the download number for an older version, you must first select that version on the module or provider's page and then select it in the metrics box.

These changes also provide admins and owners of modules and providers with additional information. If you are an admin for your module or provider on the Terraform public registry, or an owner in the Terraform private registry, you will see a "Download [module/provider] metrics" button. This button allows you to get a .csv file with the download counts for your module or provider by version, month, and year for all time and all versions, making it easier to run your own analysis on the data.


»The Evolution of How We Measure Download Counts
In 2017, HashiCorp announced the Terraform module registry. At that time, the download count was calculated based on the number of times Terraform requested a download URL from registry.terraform.io. We displayed this information as "total provisions."

As we added more providers to the Terraform Registry, we added a new field in our database to account for provider downloads. This also required us to update how we calculated downloads, because we needed to account for two kinds of artifacts. We displayed the information for providers as "installs".

To combine the work of tracking usage of both modules and providers, we created a job that ran periodically and carried out the following actions:
Download all new Fastly logs from our S3 storage.
Parse the logs using regular expressions to build a map of the download count.
Construct a SQL update statement to increment the download counts.
Record the processed log file name to avoid double-counting downloads.
Perform garbage collection on old processed log records from the previous step.
At first, this worked very well. But we began to notice problems over time. We found some issues with case-sensitivity, where the counting code used case-sensitive comparisons but the downloading/response mechanism is case-insensitive. This meant that the count would miss instances of datadog because the namespace is “DataDog”. The count job also couldn't account for providers or modules that had moved or changed namespaces. Most importantly, the Registry gets a lot of traffic. As usage stacked up, the SQL update statement got bigger and slower, causing deadlocks and failures that, combined with our clean-up job, began to cause problems. While 98% of our download requests were showing up properly, we weren't happy with the 2% being so inconsistent.
We initially tried to remedy each issue as it came up. But we quickly realized that was going to be a never-ending task if we didn't fix the root cause. We had the option to go through and fix the job so it was case-insensitive and recognized moves. But that would still require us to make the update statement more manageable and ensure that it was scalable well into the future.
When we took up the task, we made two decisions:
Count the number of times a module or provider has been requested from the registry via
initor request to the specific API endpoint as a "download".,Update the database schema for module and provider download logs to follow a time-series design.
We created a model of single-timestamp rows, with the count of one day's downloads rolled up into a single row. The time of the successful download is recorded as downloaded_at, and modules and providers have their own downloads table, respectively. Storing one row for downloads per day has the advantage of constructing a query to satisfy a broad range of metrics-gathering needs.
To support this work, we released a v2 namespace API. We're using the API predominantly for download count support, but it's worth noting that this version of the API isn't yet fully public or used for all things in the Registry. As part of the migration effort to v2, support for fetching providers by id was added. This route is now duplicated because it supports both namespace/name path parameters and id. This has the added bonus of maintaining the integrity of download counts in the event of a move or namespace change. The module or provider path is appended with /downloads and accepts filter parameters.
We've done similar work in the Terraform private registry, using the time-series schema. But since the private registry has a significantly smaller request volume, we populate it synchronously. These download log entries can be collected and written to the download logs tables in batch statements, as needed.
»Learn More
We are really happy with the updates we've made to our processing, storage, and presentation of download metrics. We hope you enjoy the clearer, more consistent data.
To learn more, check out the Terraform Registry documentation. To talk to other community members about using or publishing modules and providers, check out the Terraform topics on our Discuss forums. If your company is interested in writing and publishing a provider, read more about our Terraform Provider Integrations program.
To look deeper into Terraform, check out our Terraform Learn Tutorials or get started at the Terraform product page.


