Update: For the most up to date information on distributed tracing in Consul service mesh (Connect), visit our distributed tracing documentation.
HashiCorp Consul's service mesh capability can be used to bridge the gap between workloads and enable distributed tracing. In this post, we will examine how to apply Consul's service mesh features for tracing and observing traffic across applications running .NET or .NET Core frameworks.
Moving from legacy to greenfield might involve migrations from datacenter to cloud, virtual machines to containers, or .NET to .NET Core frameworks. In these use cases, tracing with a service mesh can enrich traces with service metadata such as IP addresses or versions without the need to declare annotations within application code. Legacy applications without tracing can be added to the service mesh with the injection of a tracer on start-up and a Consul sidecar proxy.
»Tracing .NET Applications
Distributed tracing tracks activity during a request to an application. Tracing uses spans to reflect the time for specific activities to complete between services or within application code. In the .NET framework, we can use the zipkin4net library for the Zipkin tracing system or the OpenTracing specification for the Jaeger tracing system.
To implement tracing, we inject the tracing library dependency and build a tracing span within the application code. For example, we must inject and include OpenTracing spans in our ASP.NET Core MVC controller code in order to trigger a span.
using Microsoft.AspNetCore.Mvc;
using System.Collections.Generic;
using System.Threading.Tasks;
using Expense.Models;
using OpenTracing;

namespace expense.Controllers
{
       // Omitted for clarity
        [HttpGet]
        public async Task<ActionResult<IEnumerable<ExpenseItem>>> GetExpenseItems()
        {
            using (IScope scope = _tracer.BuildSpan("expense-list").StartActive(finishSpanOnDispose: true))
            {
                return await _context.ListAsync();
            }
        }
}
Once we implement the span in the controller, the OpenTracing library can track database calls from the application to the database. It applies the “expense-list” label to trace metadata in order to correlate events within the application code. However, we may also want to include service metadata such as IP addresses, service versioning, or environment information to better troubleshoot our requests. In the example, we need to manually include an annotation in application code to retrieve the metadata and add it to the span. In the next sections, we will demonstrate how to configure and use a service mesh to enrich traces with service metadata.
»Configuring the Service Mesh
In these examples, we leverage a set of ASP.NET Core services designed to track travel expenses. These include:
- A Microsoft SQL Server database for storing travel expenses.
- An expense service for recording travel expenses.
- A report service for retrieving a list of expenses for a given trip.
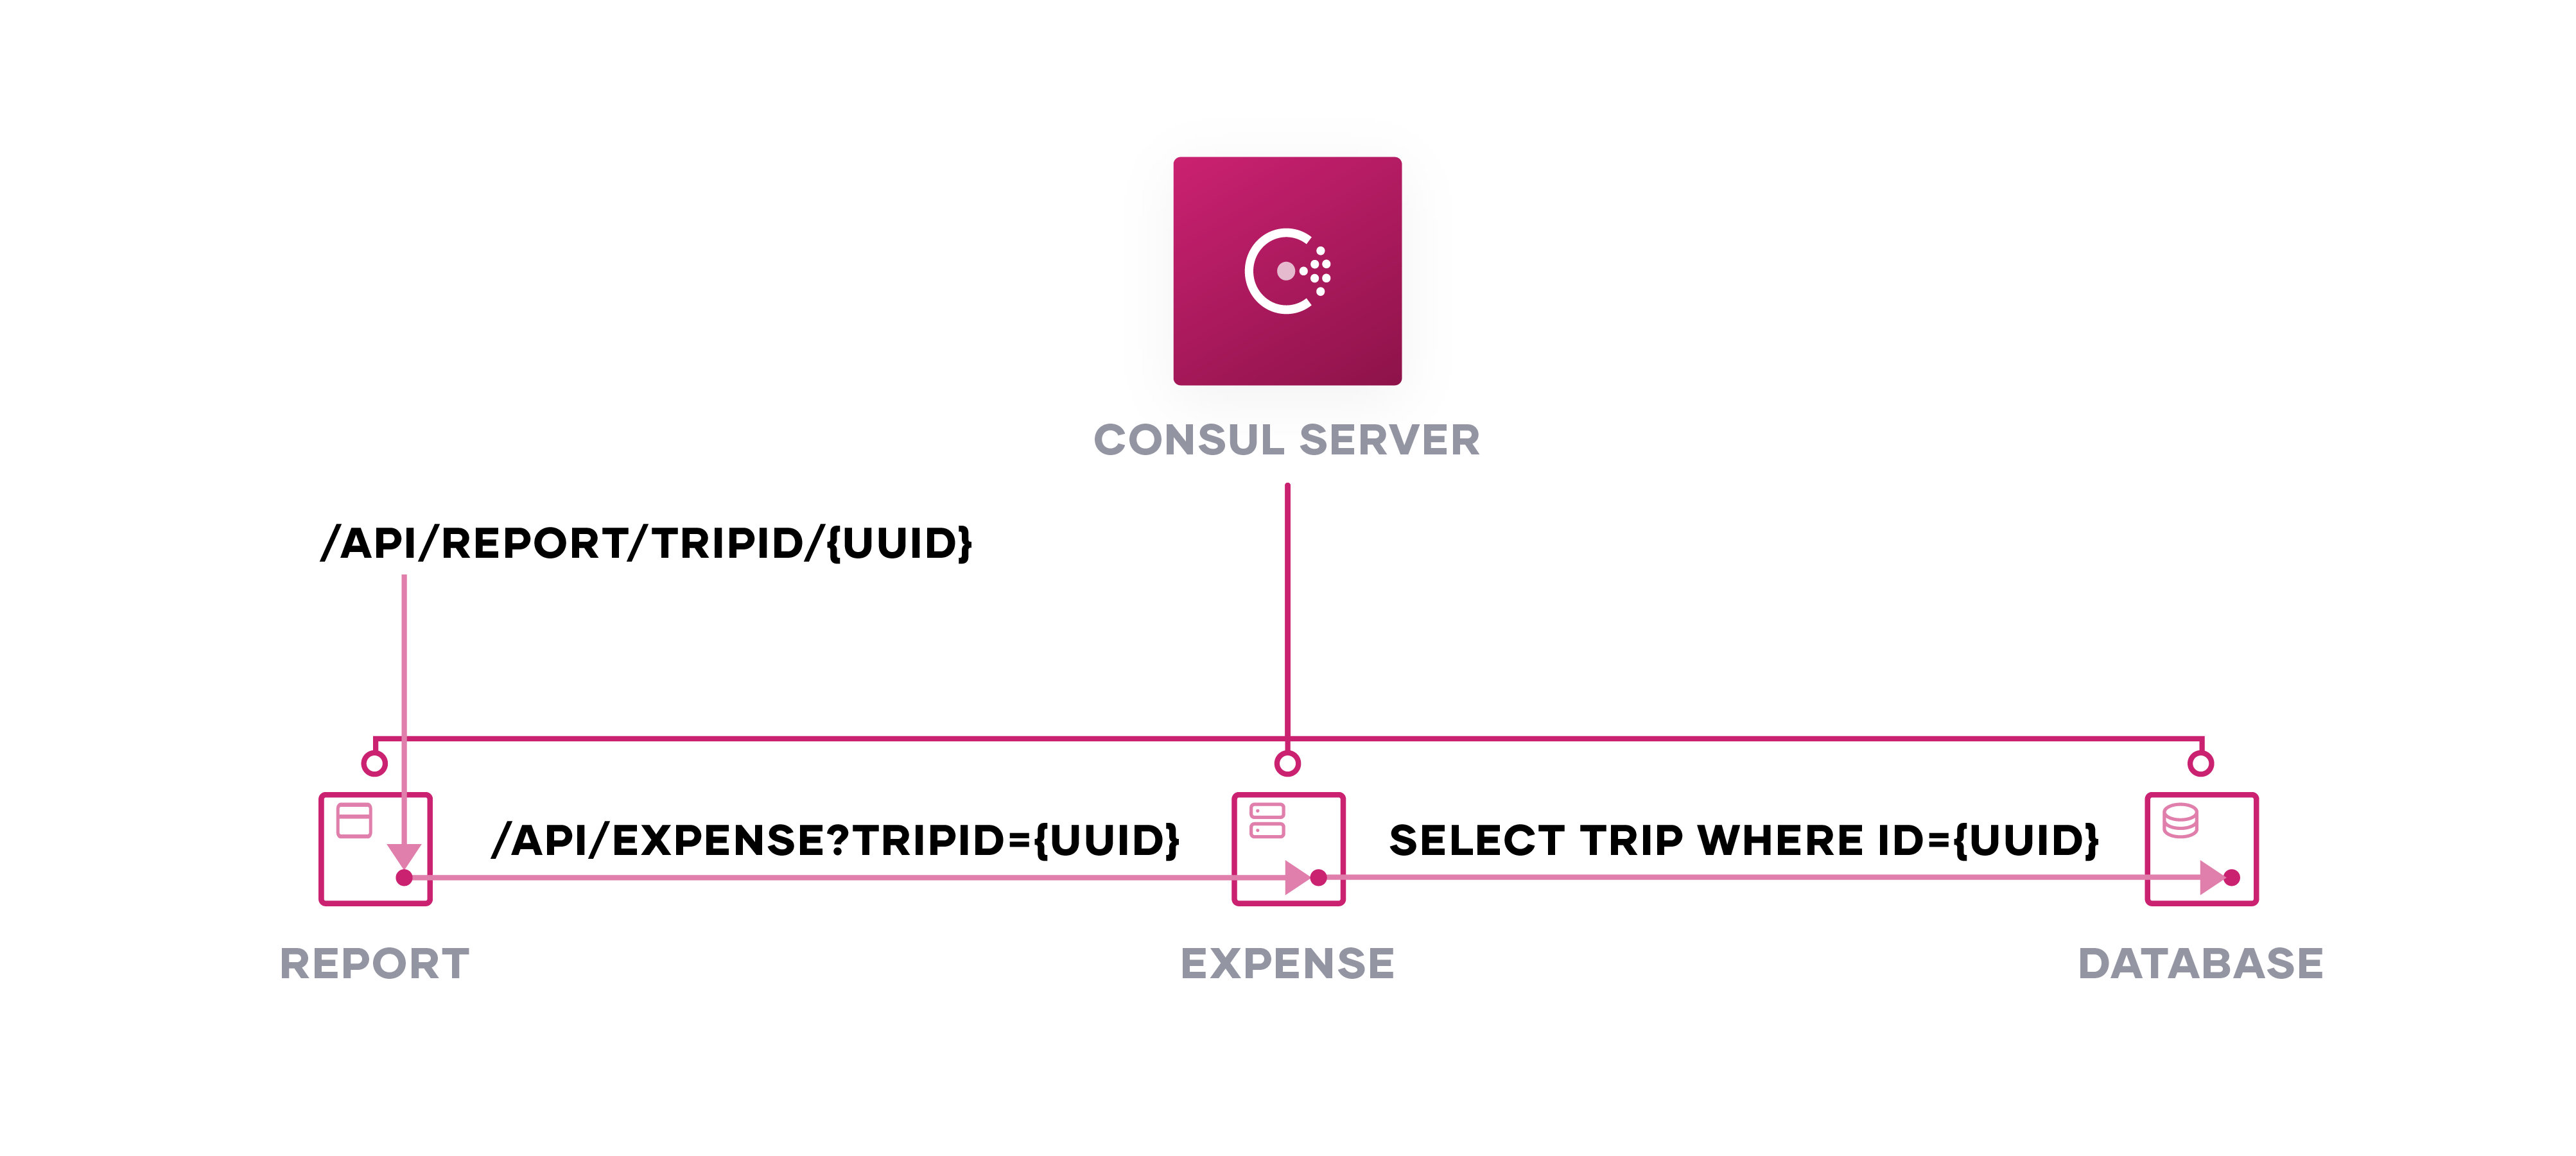
The expense service writes expense details to the database and the report service calls the expense service for expenses related to a trip. Each service passes traffic through a Consul client proxy, in this case Envoy proxy. We configure each proxy to point to its upstream service, such as the expense service referencing the expense database.
service {
 name    = "expense"
 port    = 5001
 // omitted for clarity

 tags = ["v1"]
 meta = {
   version = "1"
 }

 connect {
   sidecar_service {
     port = 20000

     check {
       // omitted for clarity
     }

     proxy {
       upstreams {
         destination_name   = "expense-db"
         local_bind_port    = 1433
       }
     }
   }
 }
}
In the application’s configuration, we can use localhost:${port} as the connection string to the database rather than the external endpoint. The proxy is configured to listen to the local port, and automatically establish a secure connection to the upstream service. For example, an ASP.NET Core’s default appsettings.json can continue to reference the default 127.0.0.1:1433 for a database, easing configuration for local testing and remote testing.
{
 "ConnectionStrings": {
   "ExpensesDatabase": "Server=.;Database=DemoExpenses;user id=SA;password=Testing!123"
 }
}
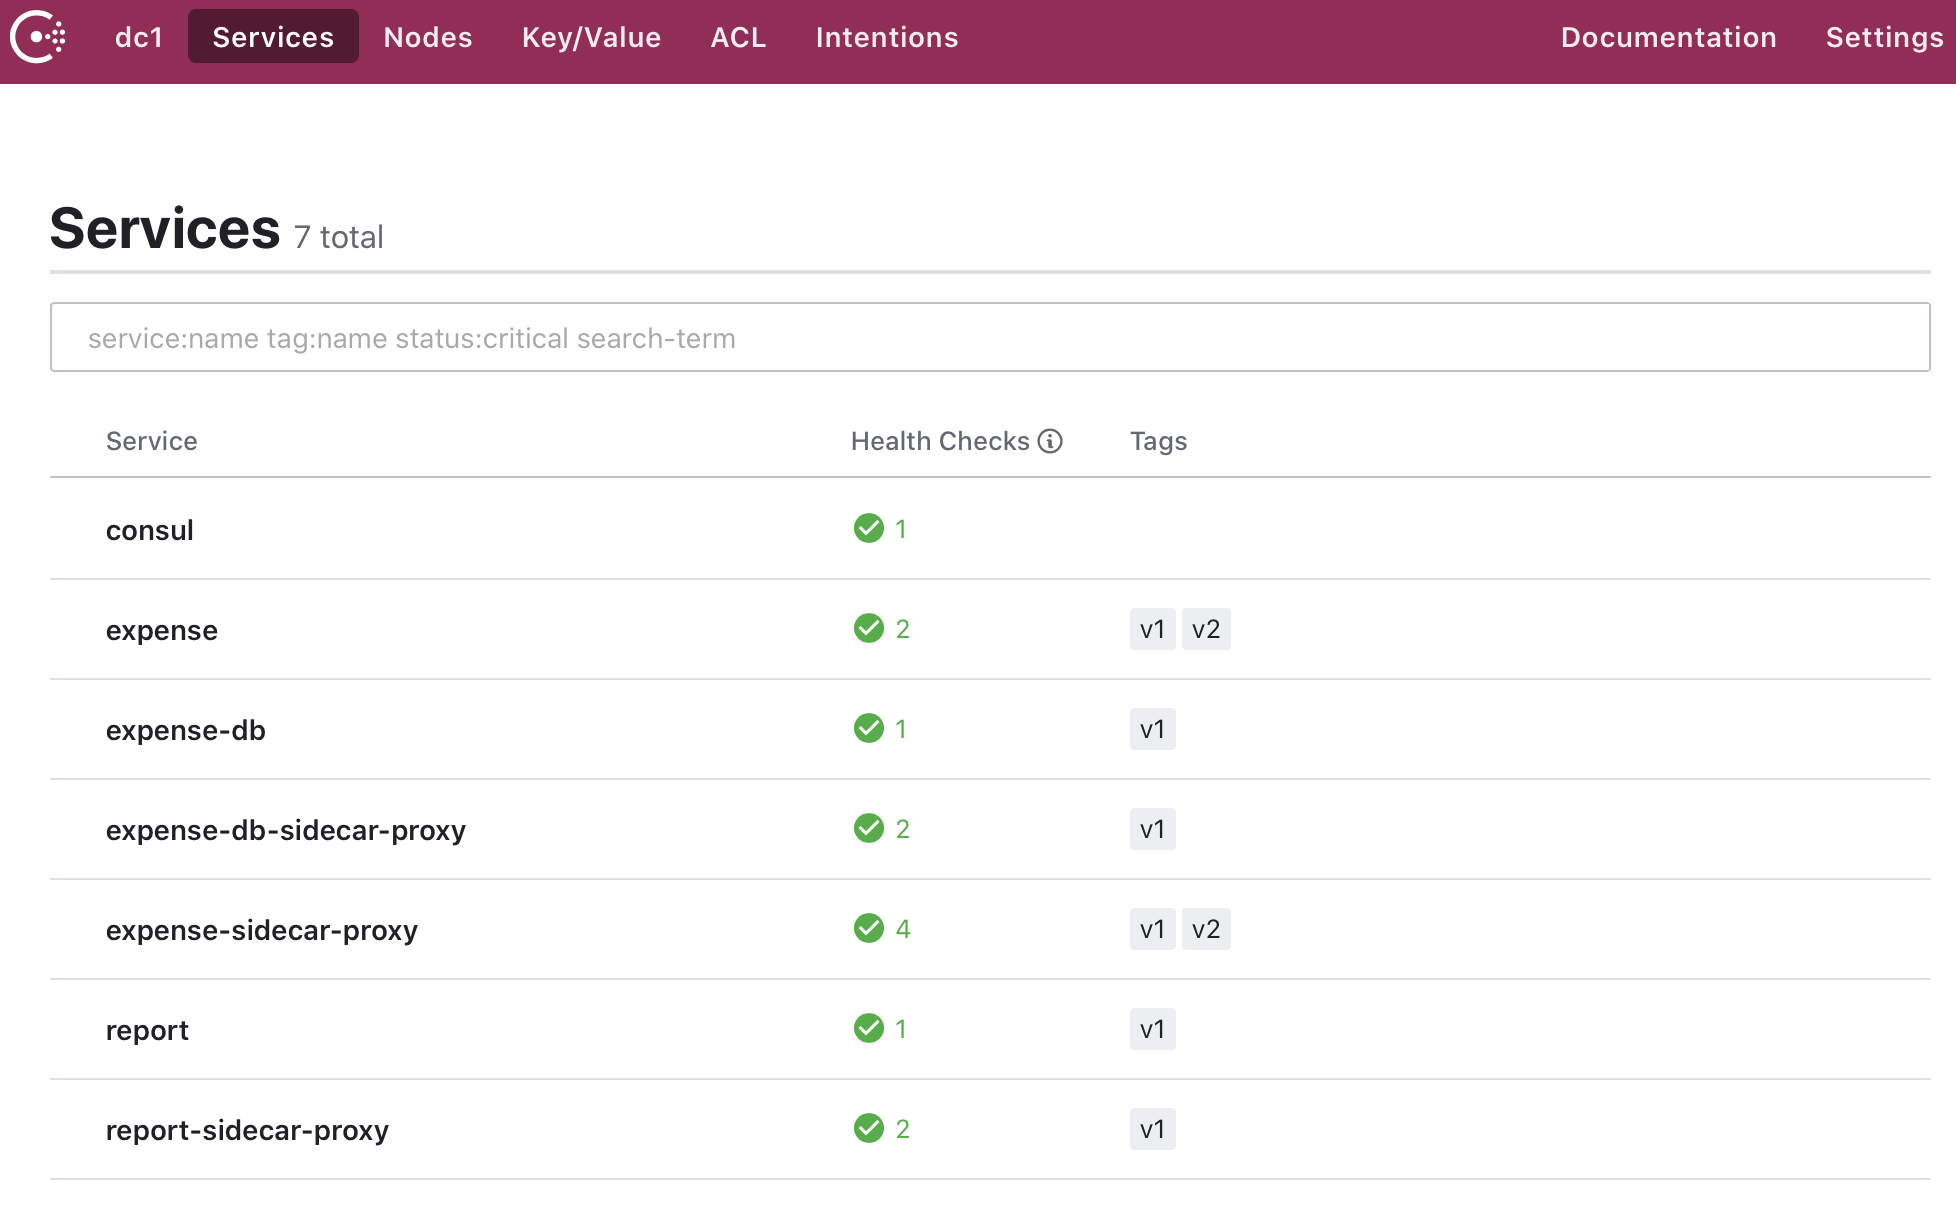
By deploying a proxy sidecar with each service, we automatically register each service into Consul. When we go to Consul and view the services, we see the expense, database, and report services with their proxies.

»Tracing .NET Applications with Service Mesh
To minimize the code required for tracing within the application, we use proxies to pass tracing metadata and record the request. First, we find a compatible library for the specific .NET framework, Consul Envoy proxy, and external tracer. At the time of this post, Consul supports Envoy 1.11.1, which must use the Zipkin span format. We use zipkin4net to implement the Zipkin span format.
We need to ensure tracing metadata propagates correctly from parent to child spans. By injecting a Zipkin tracer on application start-up, zipkin4net automatically propagates the necessary B3 headers for Zipkin to trace context within our API controllers.
using zipkin4net;
using zipkin4net.Tracers.Zipkin;
using zipkin4net.Transport.Http;
using zipkin4net.Middleware;

namespace Expense
{
 public class Startup
 {
   public void Configure(IApplicationBuilder app, IHostingEnvironment env, ILoggerFactory loggerFactory)
   {
     // Omitted for clarity

     var lifetime = app.ApplicationServices.GetService<IApplicationLifetime> ();
     IStatistics statistics = new Statistics();

     lifetime.ApplicationStarted.Register (() => {
         TraceManager.SamplingRate = 1.0f;
         var logger = new TracingLogger(loggerFactory, "zipkin4net");
         var httpSender = new HttpZipkinSender(Configuration.GetConnectionString("Zipkin"), "application/json");
         var tracer = new ZipkinTracer(httpSender, new JSONSpanSerializer (), statistics);
         TraceManager.Trace128Bits = true;
         TraceManager.RegisterTracer(tracer);
         TraceManager.Start(logger);
     });

     lifetime.ApplicationStopped.Register(() => TraceManager.Stop());
     app.UseTracing("expense");

     app.UseMvc();
   }
 }
}
Once we have injected the Zipkin tracer for header propagation, we can forward the traces to a Jaeger collector. After we make a GET request to our report service, Jaeger records the request as the report service calling the expense service. We see that the sidecar proxy for the expense service receives the request and forwards it to the application instance. Jaeger also notes the response code (HTTP 200) returned by the application.
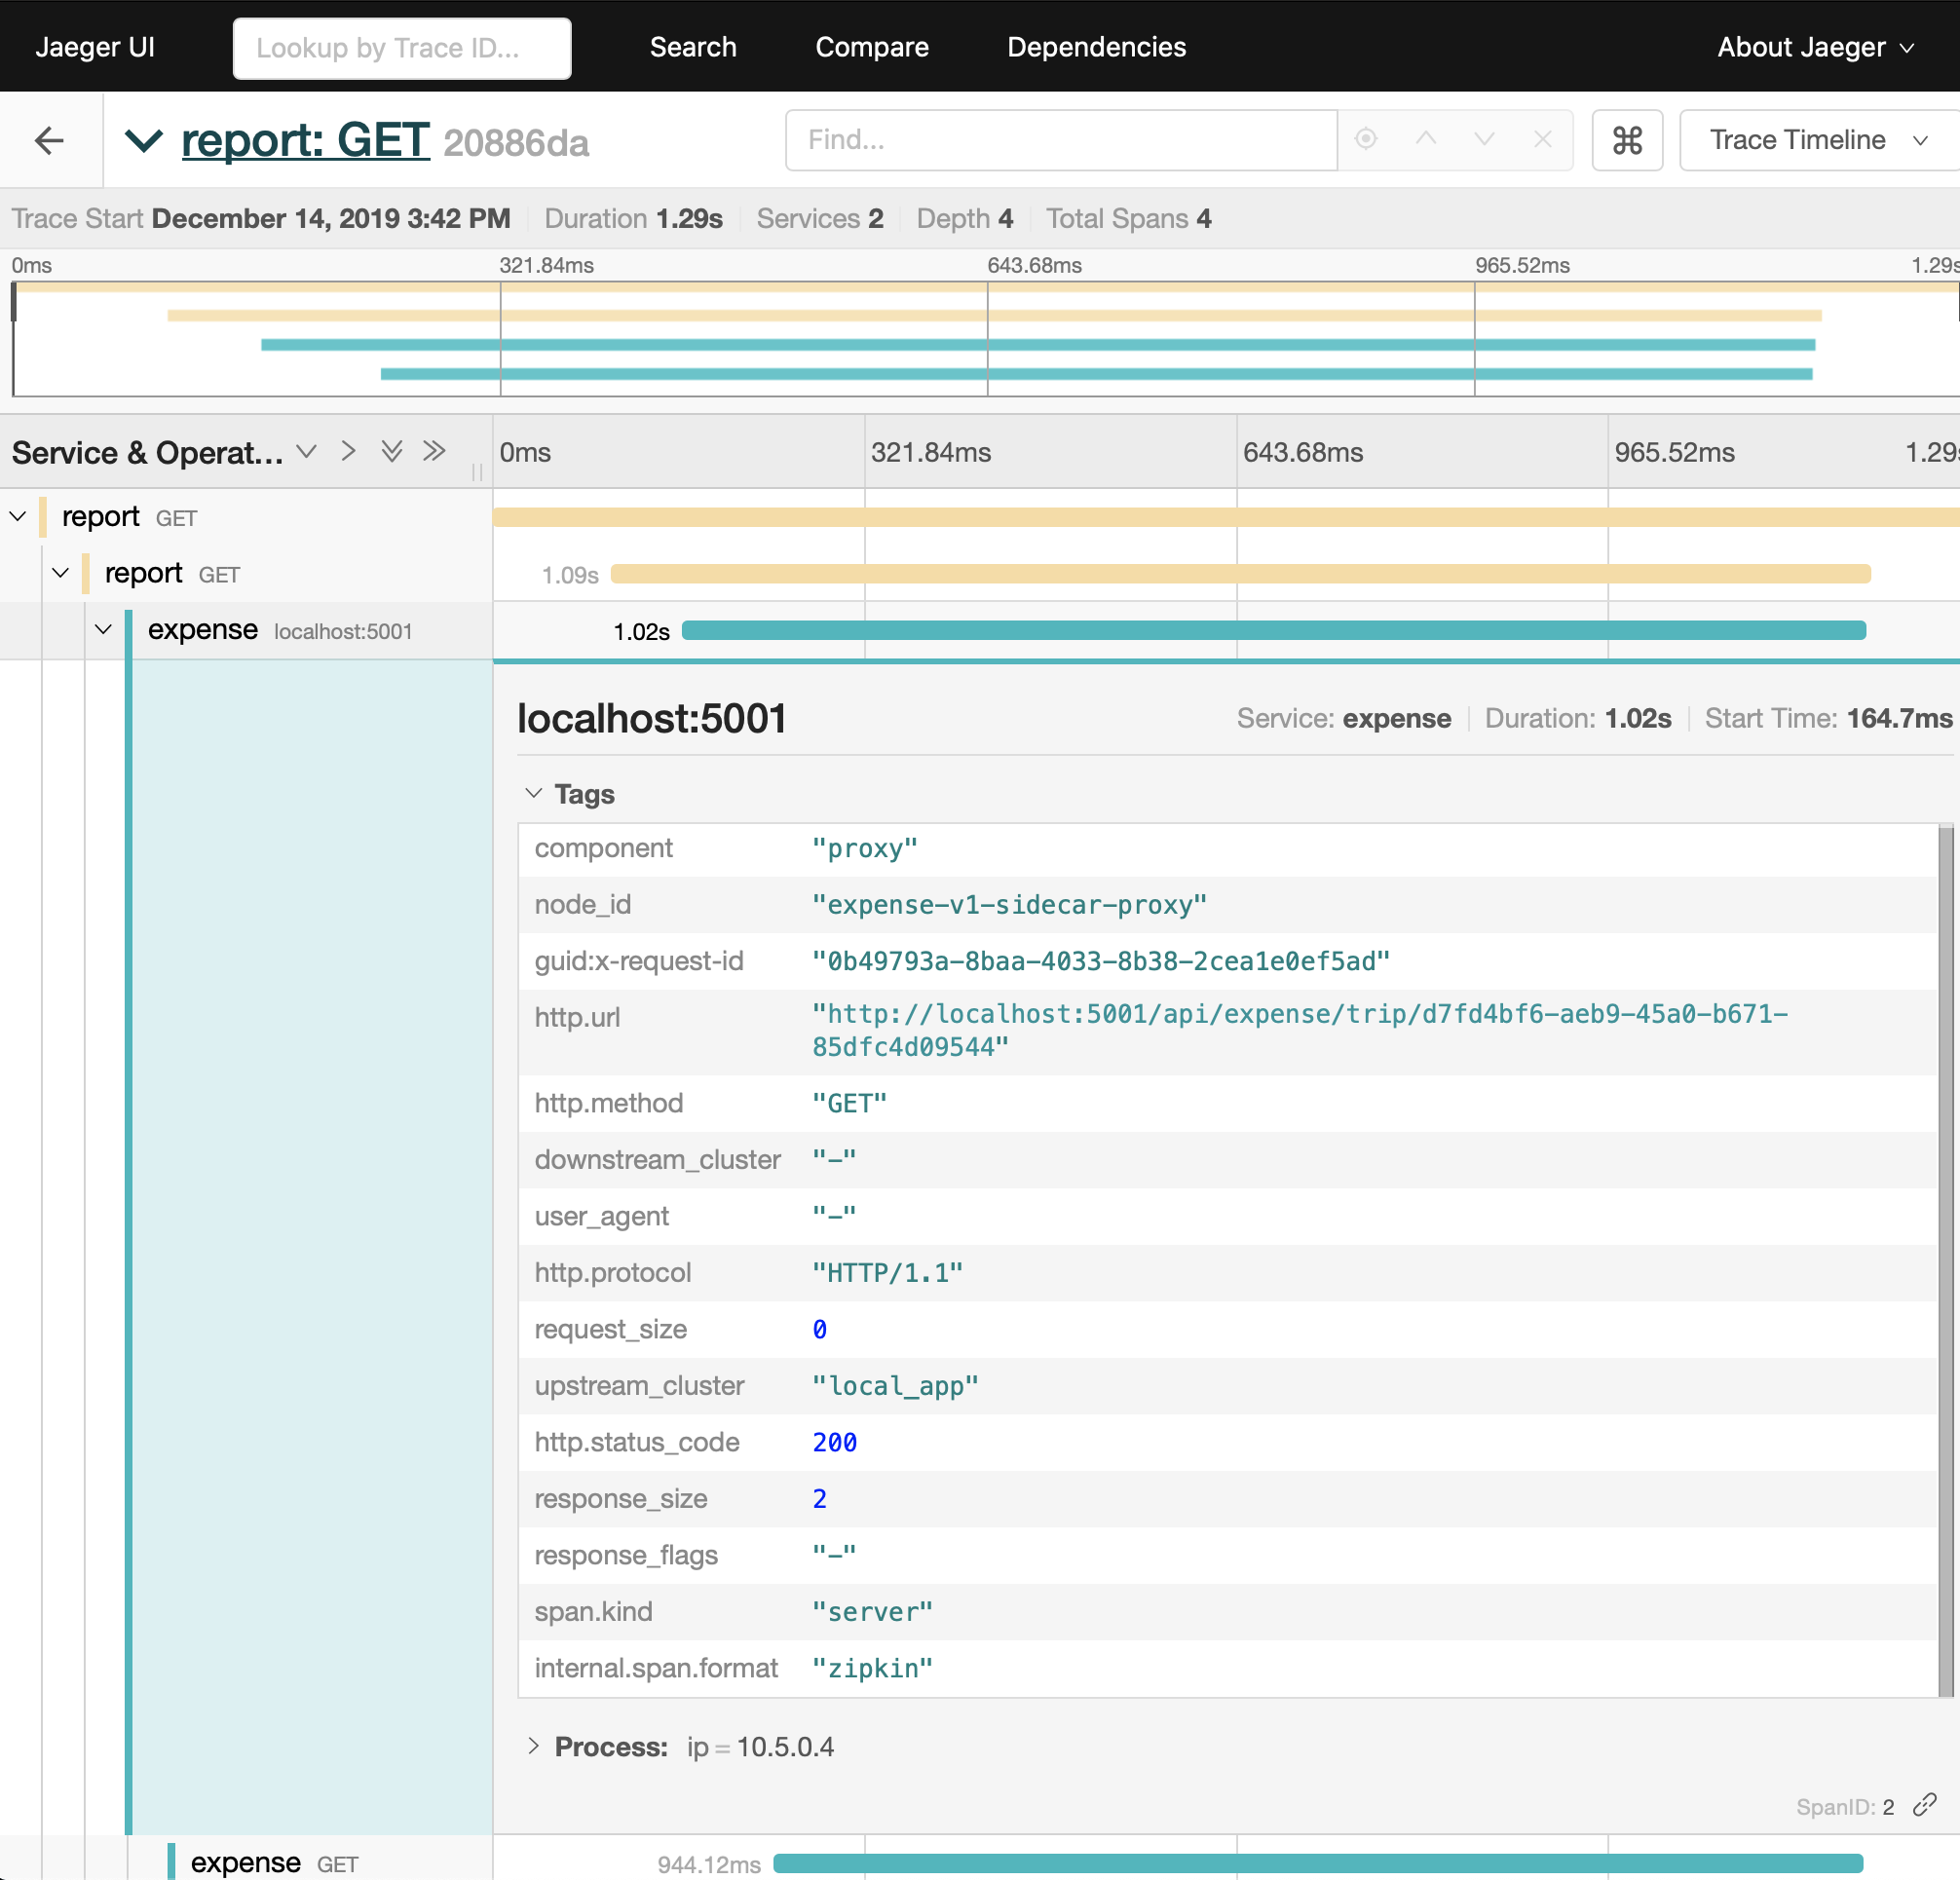
In the trace of the sidecar proxy, our tracing library automatically adds some annotations, including http.method and http.url. When implementing distributed tracing with a sidecar proxy, the application itself must propagate the B3 headers associated with the Zipkin span in order to correlate the outbound request to an inbound request. While we still need to inject the Zipkin tracer implementation on application start-up, we do not need to annotate and build additional spans within application code. The Consul sidecar proxy automatically adds tracing metadata and propagates fields between services.
»Tracing Services with Unsupported Protocols
When we examine our traces in the service mesh, we do not see our service’s transaction calls to the Microsoft SQL Server database. Microsoft SQL Server uses its own protocol that has not yet been added to the Envoy proxy. While the proxy recognizes the Layer 4 request to the database, tracing requires Layer 7 headers to record spans. As a result, we need to configure the database call to propagate Layer 7 headers.
In order to add traces for database calls, we must include a span to log the application call to the database. First, we retrieve the parent span for the trace. With the database call originating from an API request, we create a child span that has a reference to the parent span. Then, we start a local operation, timestamping the start of the database call. We add additional annotations noting the specific request, function, and corresponding service.
using zipkin4net;

namespace Expense.Contexts
{
   public class ExpenseContext: BaseContext, IExpenseContext
   {
     // omitted for clarity
     public async Task<ActionResult<IEnumerable<ExpenseItem>>> ListAsyncByTripId(string tripId)
     {
       var parentTrace = Trace.Current;
       var trace = parentTrace.Child();
       trace.Record(Annotations.LocalOperationStart("database"));
       trace.Record(Annotations.ServiceName("expense"));
       trace.Record(Annotations.Tag("request", "list-expenses"));
       trace.Record(Annotations.Rpc("SELECT"));
       var items = await _context.ExpenseItems.Where(e => e.TripId == tripId).ToListAsync();
       trace.Record(Annotations.LocalOperationStop());
       return items;
     }
   }
}
When we make a call to our report service, Jaeger logs the database request from the expense service as a local operation. In this implementation, we can use the span to track the response time of the database but not if the call results in an error.

As we demonstrate with our database example, upstream services that do not leverage Envoy proxy’s supported protocols must include application code in their downstream service to manually annotate the tracing spans and correlate requests with their originator.
»Troubleshooting Traffic Management with Traces
We can control and shape traffic between legacy and greenfield .NET applications to minimize downtime during migration and facilitate testing of services in production. For example, we might refactor our expense service to move it from a virtual machine (version 1) to Kubernetes (version 2). While the virtual machine version runs successfully in production, we want to ensure our new version is ready for release.
Instead of using a load balancer or DNS entry, we can use Consul's service mesh capability to divide traffic between the old (version 1) and the new (version 2) versions of the expense service with a service splitter. Since services are already registered with Consul, we can add a new expense service definition with identifier and tag labeling it as “version 2”.
service {
 name    = "expense"
 id      = "expense-v2"
 // omitted for clarity

 tags = ["v2"]
 meta = {
   version = "2"
 }

 connect {
   sidecar_service {
     port = 20000

     check {
       // omitted for clarity
     }

     proxy {
       upstreams {
         destination_name   = "expense-db"
         local_bind_port    = 1433
       }
     }
   }
 }
}
When we deploy the new version of the expense service with its sidecar, we notice that Consul tags the expense service with each version and includes the metadata for the version.
Next, we create a service-resolver configuration file for Consul to resolve the two subsets of expense, namely version 1 and version 2.
// expense_service_resolver.hcl
kind = "service-resolver"
name = "expense"

default_subset = "v1"

subsets = {
 v1 = {
   filter = "Service.Meta.version == 1"
 }
 v2 = {
   filter = "Service.Meta.version == 2"
 }
}
We also create a service-splitter configuration file to divert 50% of traffic to version 1 and 50% of traffic to version 2 of the expense service.
// expense_service_splitter.hcl
kind = "service-splitter",
name = "expense"

splits = [
 {
   weight = 50,
   service_subset = "v1"
 },
 {
   weight = 50,
   service_subset = "v2"
 }
]
We write both configuration files to Consul using the command line.
$ export CONSUL_HTTP_ADDR=${consul_cluster_address}
$ consul config write expense_service_resolver.hcl
$ consul config write expense_service_splitter.hcl
We can tell if Consul receives the configuration by checking the configuration entry on the Consul server.
$ export CONSUL_HTTP_ADDR=${consul_cluster_address}
$ consul config read -kind service-splitter -name expense                                                                                     {
    "Kind": "service-splitter",
    "Name": "expense",
    "Splits": [
        {
            "Weight": 50,
            "ServiceSubset": "v1"
        },
        {
            "Weight": 50,
            "ServiceSubset": "v2"
        }
    ],
    "CreateIndex": 165,
    "ModifyIndex": 213
}
By applying a service-splitter, we control how much traffic we send to a new version of a service. In this particular example, we can update the configuration to gradually increase traffic to version 2 for a canary release and ensure its production readiness. For A/B testing or routing based on HTTP headers, we can instead configure a service-router.
To test our traffic split, we call the report service and initiate a trace to the expense and database services. When we open the trace details for API calls to the report service, we see the sidecar proxy adds metadata to the trace through the proxy. Based on the node_id, we see the request forwarded to expense-v2-sidecar-proxy, which is version 2 of our expense service.
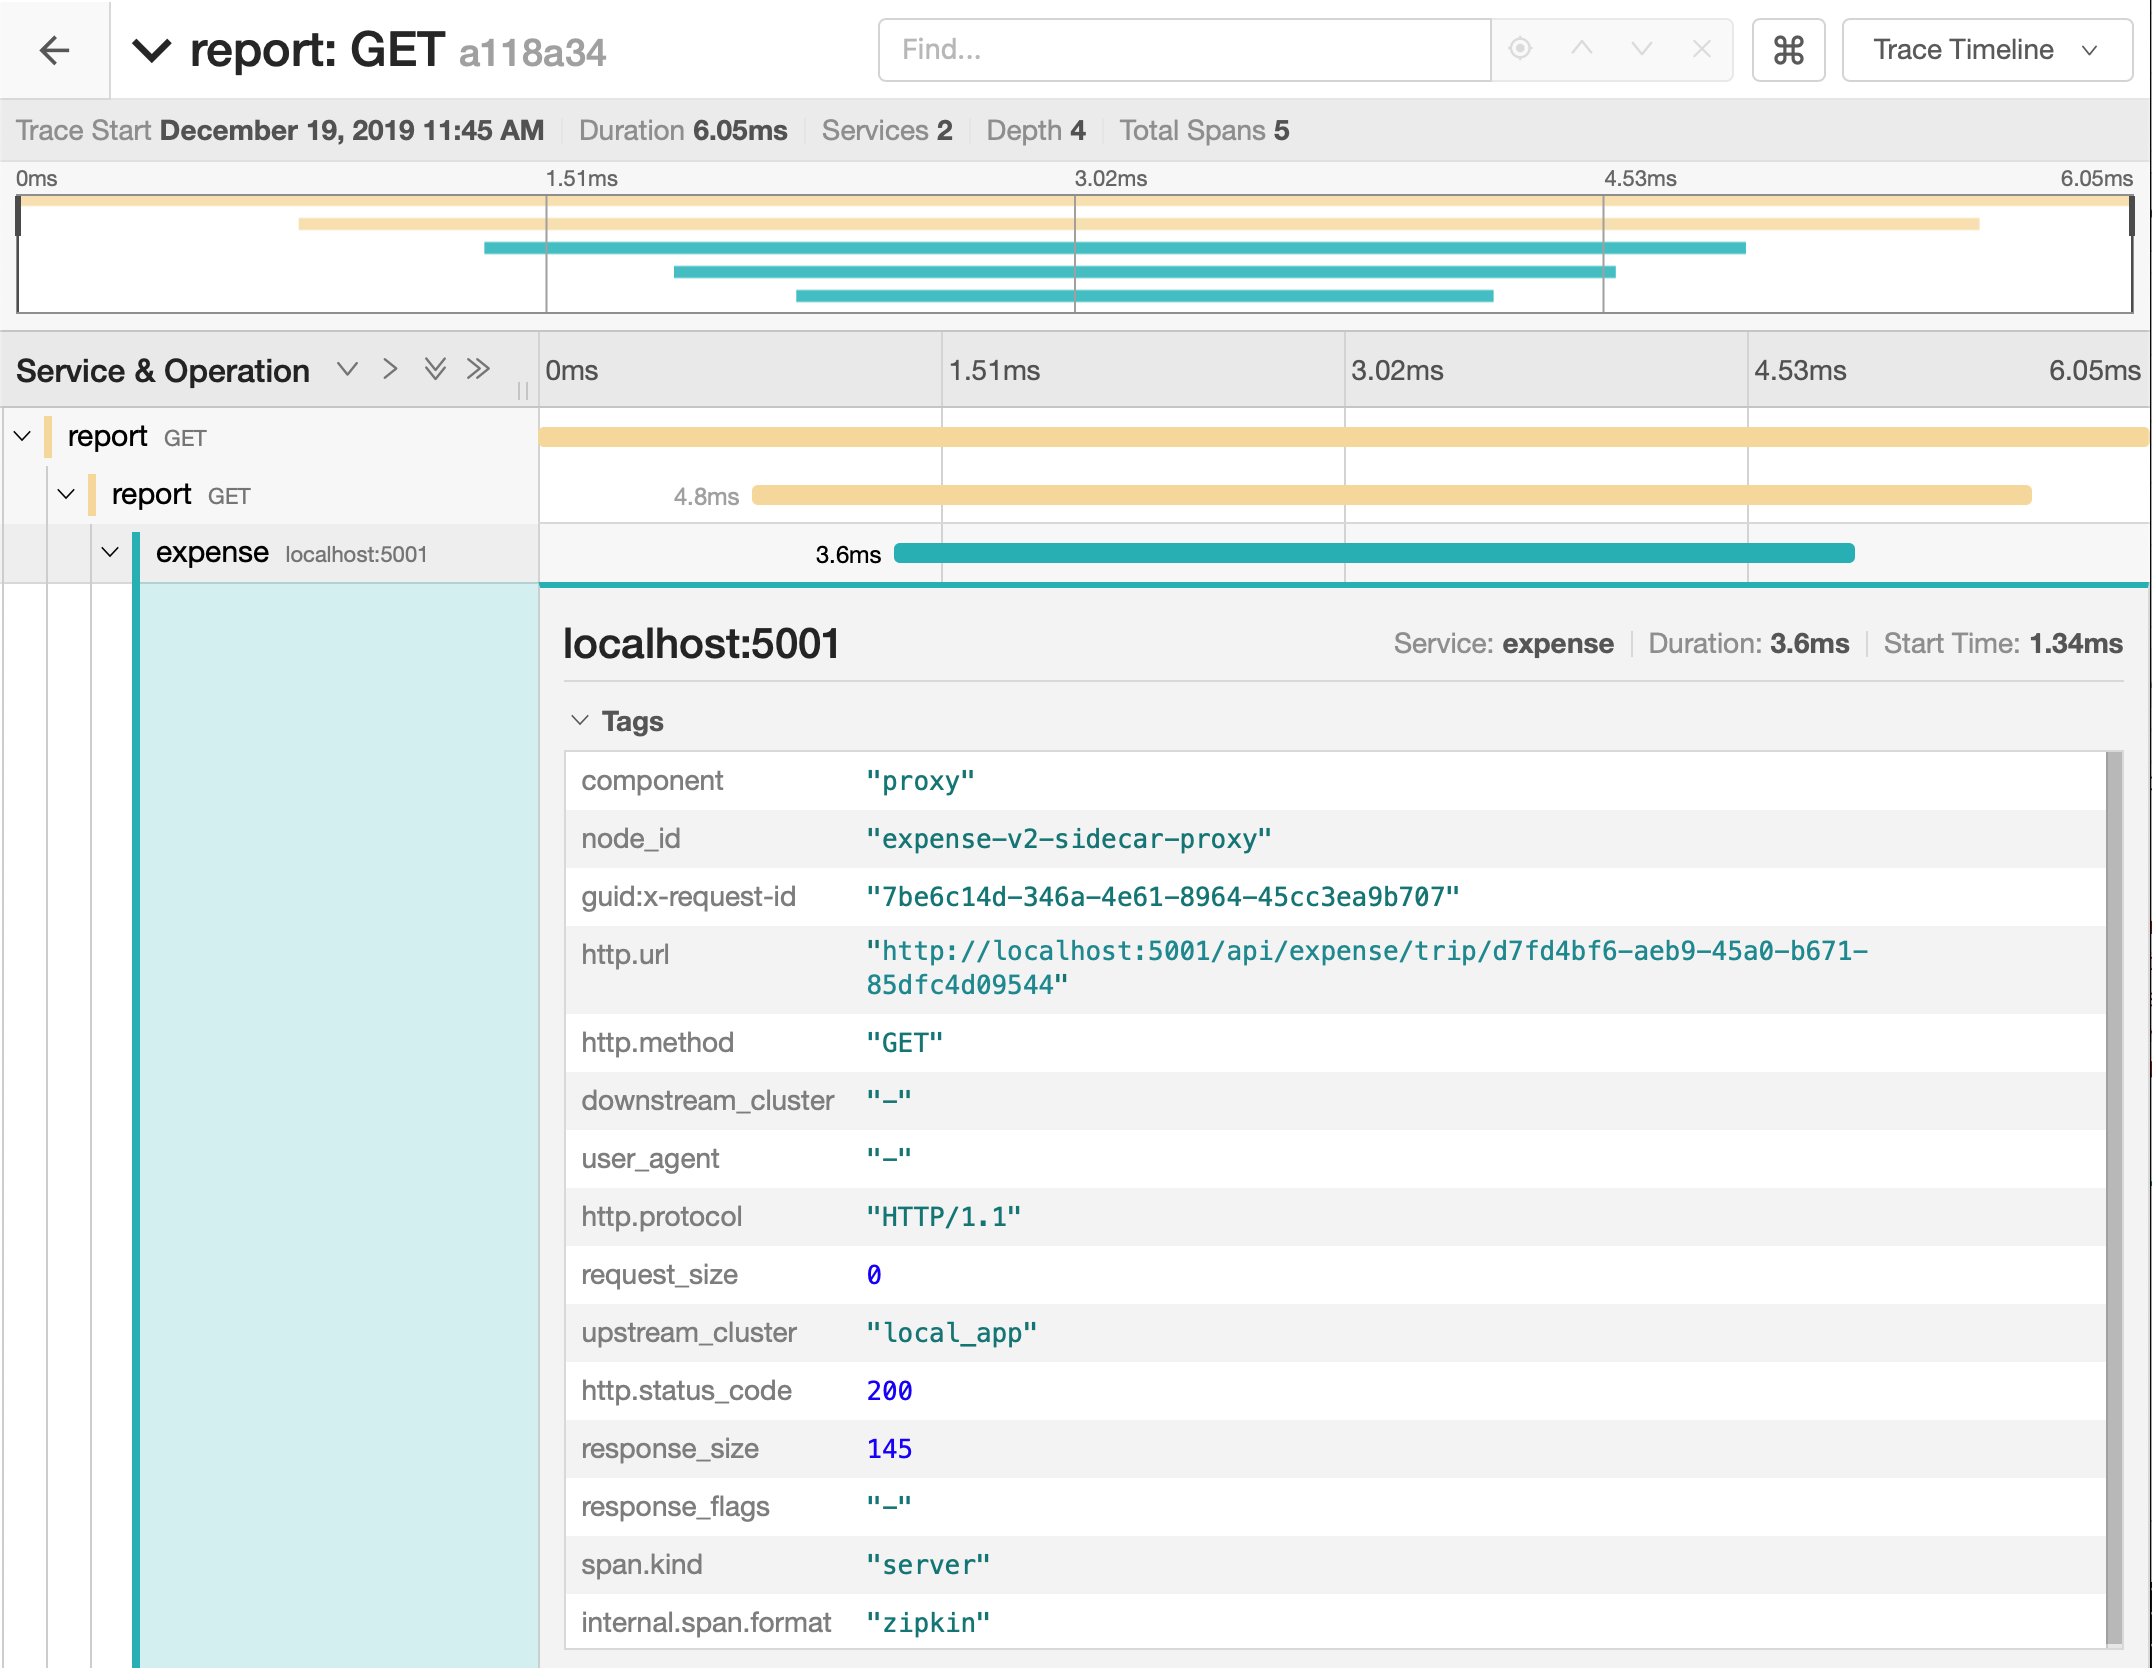
In theory, our service-splitter configuration in Consul will direct half of the calls from the report service to version 1 of expense and the other half to version 2 of expense. We can verify this by calling the expense API several times. When we examine the traces, Consul directed four of seven requests to expense-v1-sidecar-proxy and the remaining three requests to expense-v2-sidecar-proxy.
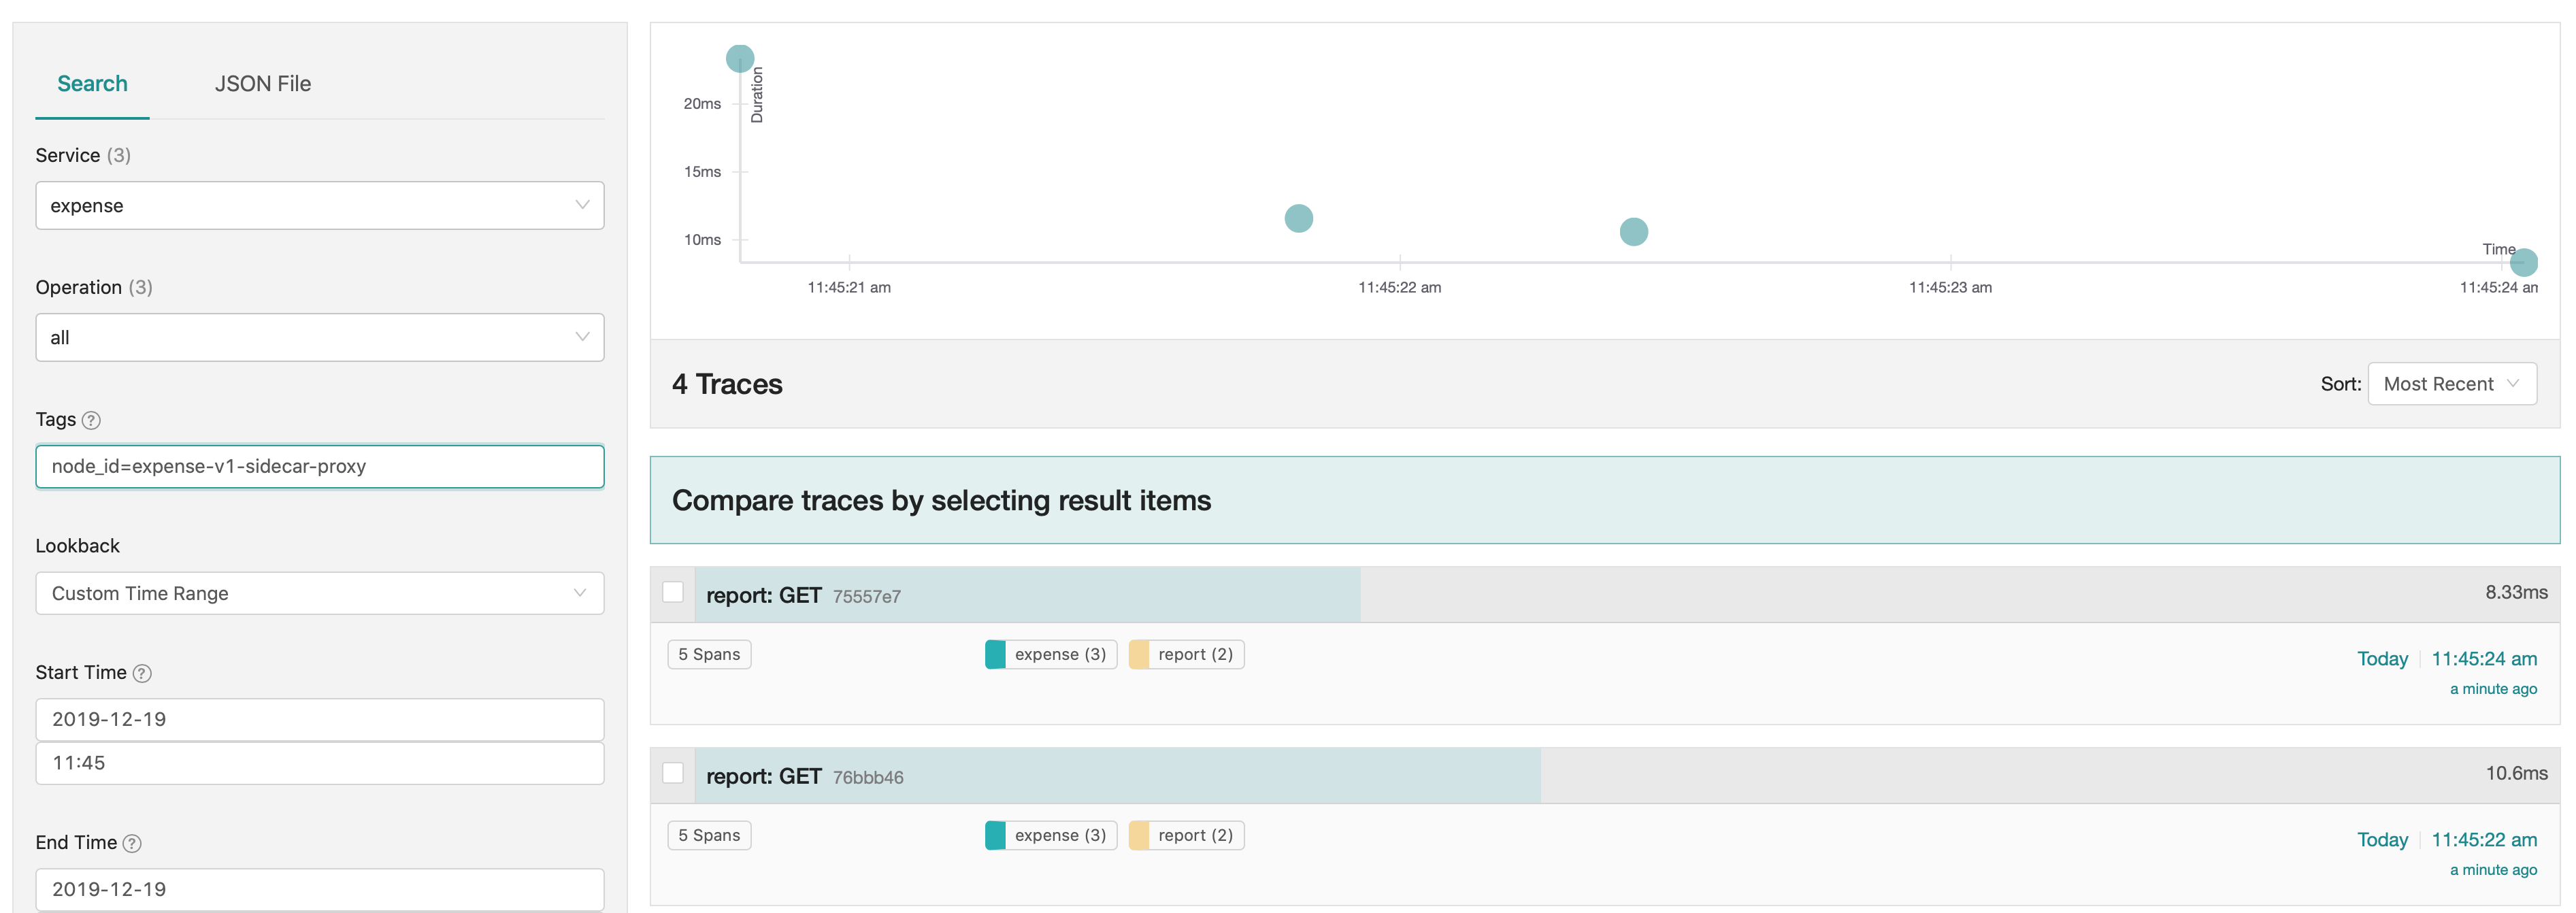

By adding tracing to our .NET applications using a service mesh, we gain insight into the flow of traffic between different versions of our services. We did not need to add additional span metadata within the application code to identify the version of the services. We can use the traces to troubleshoot and compare the behavior of a request between different versions of the same service.
»Conclusions
We demonstrated how Consul's service mesh capability can be used to shape traffic and trace transactions across .NET applications. We introduced tracing for .NET applications and added the service mesh to include service metadata in traces. For services using a network protocol not supported by Consul, we walked through the addition of a span to application code to track the operation. Finally, we used Consul to split traffic between two versions of our service and used distributed tracing to correlate the API requests to different versions of the service.
Consul's service mesh features enable us to gain additional visibility and control requests between a variety of legacy and greenfield .NET workloads. To learn more about Consul, see the HashiCorp Learn guides. In addition to basic configuration, check out a deep dive of its features. We cover distributed tracing in greater detail in a different blog post.
Note that while we mention OpenTracing and Zipkin tracing specifications at the time of this post, future contributions for these projects may merge into the OpenTelemetry project.
Post questions about this blog to our community forum!


