This is the second post of the blog series highlighting new features in Consul service mesh.
»Introduction
You’ve probably heard the term “observability” before, but what does it actually mean? Is it just monitoring re-branded, or is there more to observability than that? We are publishing a series of blog posts to discuss the core use cases of service mesh. In this blog we will take a closer look at observability and how to enable the new L7 observability features of Consul Connect that are included in the recent Consul 1.5 release.
To get started, let’s revisit a familiar concept: monitoring.
»Monitoring
Monitoring means instrumenting your applications and systems with internal or external tools to determine their state.
For example, you may have an external health check that probes an application’s state or determines its current resource consumption. You may also have internal statistics which report the performance of a particular block of code, or how long it takes to perform a certain database transaction.
»Observability
Observability comes from the world of engineering and control theory. Control theory states that observability is itself a measure that describes “how well internal states of a system can be inferred from knowledge of external outputs”. In contrast to monitoring which is something you do, observability, is a property of a system. A system is observable if the external outputs, logging, metrics, tracing, health-checks, etc, allow you to understand its internal state.
Observability is especially important for modern, distributed applications with frequent releases. Compared to a monolithic architecture where components communicate through in-process calls, microservice architectures have more failures during service interactions because these calls happen over potentially unreliable networks. And with it becoming increasingly difficult to create realistic production-like environments for testing, it becomes more important to detect issues in production before customers do. A view into those service calls helps teams detect failures early, track them and engineer for resiliency.
With Modular and independently deployable (micro)services, visibility into these services can be hard to achieve. A single user request can flow through a number of services that are each independently developed and deployed by different teams. Since it’s impossible to predict every potential failure or problem that can occur in a system, you need to build systems that are easy to debug once deployed.Insight into the network is essential to understand the flow and performance of these highly distributed systems.
»Service Mesh
A service mesh is a networking infrastructure that leverages “sidecar” proxies for microservice deployments. Since the sidecar proxy is present at every network hop, it captures both upstream and downstream communication. Consequently, a service mesh provides complete visibility into the external performance of all the services.
One of the key benefits of adopting a service mesh is that the fleet of sidecar proxies have complete visibility of all service traffic and can expose metrics in a consistent way, irrespective of different programming languages and frameworks. Applications still need to be instrumented in order to gain insight into internal application performance.
»Control Plane
A service mesh is traditionally built from two main components: the control plane and the data plane. The control plane provides policy and configuration for all of the running data planes in the mesh. The data plane is typically a local proxy which runs as a sidecar to your application. The data plane terminates all TLS connections and managed Authorisation for requests against the policy and service graph in the Control Plane. Consul forms the control plane of the service mesh, which simplifies the configuration of sidecar proxies for secure traffic communication and metrics collection. Consul is built to support a variety of proxies as sidecars, and currently has documented, first class support for Envoy, chosen for its lightweight footprint and observability support.
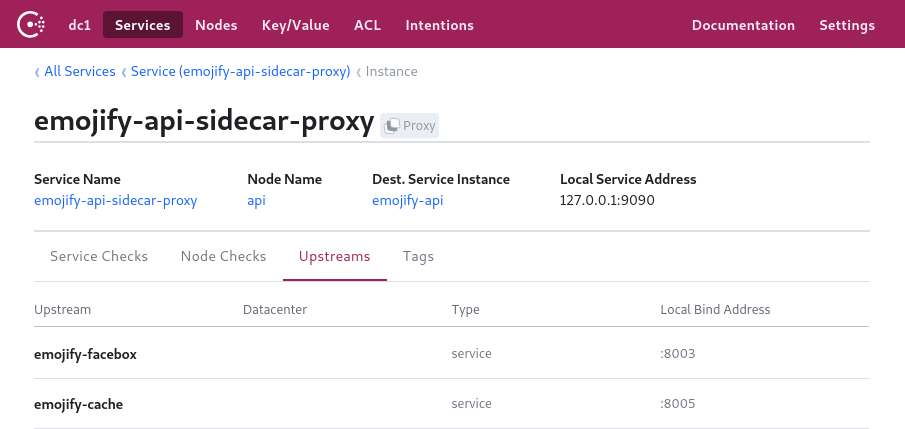 Consul UI showing the Envoy sidecar proxy and its upstream services
Consul 1.5 introduced the ability to configure metrics collection for all of the Envoy proxies in Consul Connect at once, using the consul connect envoy command. During a new discovery phase, this command fetches a centrally stored proxy configuration from the local Consul agent, and uses its values to bootstrap the Envoy proxies.
When configuring the Envoy bootstrap through Consul Connect, there is support for a few different levels of customization. The higher level configuration is the simplest to configure and covers everything necessary to get metrics out of Envoy.
The centralized configuration can be created by creating a configuration file e.g.
kind = "proxy-defaults"
name = "global"

config {
  # (dog)statsd listener on either UDP or Unix socket.
  # envoy_statsd_url = "udp://127.0.0.1:9125"
  envoy_dogstatsd_url = "udp://127.0.0.1:9125"

  # IP:port to expose the /metrics endpoint on for scraping.
  # prometheus_bind_addr = "0.0.0.0:9102"

  # The flush interval in seconds.
  envoy_stats_flush_interval = 10
}
This configuration can be written to Consul using the consul config write <filename> command.
The config section in the above file enables metrics collection by telling Envoy where to send the metrics. Currently, Consul Connect supports the following metric output formats through centralized configuration:
- StatsD: a network protocol that allow clients to report metrics, like counters and timers
- DogStatsD: an extension of the StatsD protocol which supports histograms and the tagging of metrics
- Prometheus: exposes an endpoint that Prometheus can scrape for metrics
The DogStatsD sink is preferred over statsd as it allows tagging of metrics which is essential to be able to filter them correctly in Grafana. The prometheus endpoint will be a good option for most users once Envoy 1.10 is supported and histograms are emitted.
Consul will use the configuration to generate the bootstrap configuration that Envoy needs to setup the proxy and configure the appropriate stats sinks. Once the Envoy proxy is bootstrapped it will start emitting metrics. You can capture these metrics in a timeseries store such as Prometheus and query them in a tool like Grafana or send them to a managed monitoring solution. Below is an example of a Prometheus query you can write against the resulting metrics, which takes all the request times to the upstream "emojify-api" cluster and then groups them by quantile.
# The response times of the emojify-api upstream,
# categorized by quantile
sum(envoy_cluster_upstream_rq_time{envoy_cluster_name="emojify-api"} > 0) by (quantile)
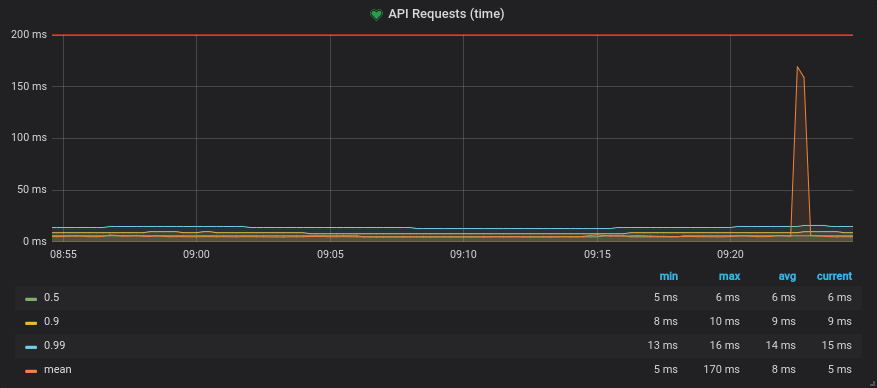 Resulting graph showing the request time quantiles
Envoy emits a large number of statistics depending on how it is configured. In general there are three categories of statistics:
- Downstream statistics related to incoming connections/requests.
- Upstream statistics related to outgoing connections/requests.
- Server statistics describing how the Envoy server instance is performing.
The statistics are formatted like envoy.<category>(.<subcategory>).metric and some of the categories that we are interested in are:
- Cluster: a group of logically similar upstream hosts that Envoy connects to.
- Listener: a named network location, like a port or unix socket, that can be connected to by downstream clients.
- TCP: metrics such as connections, throughput, etc.
- HTTP: metrics about HTTP and HTTP/2 connections and requests.
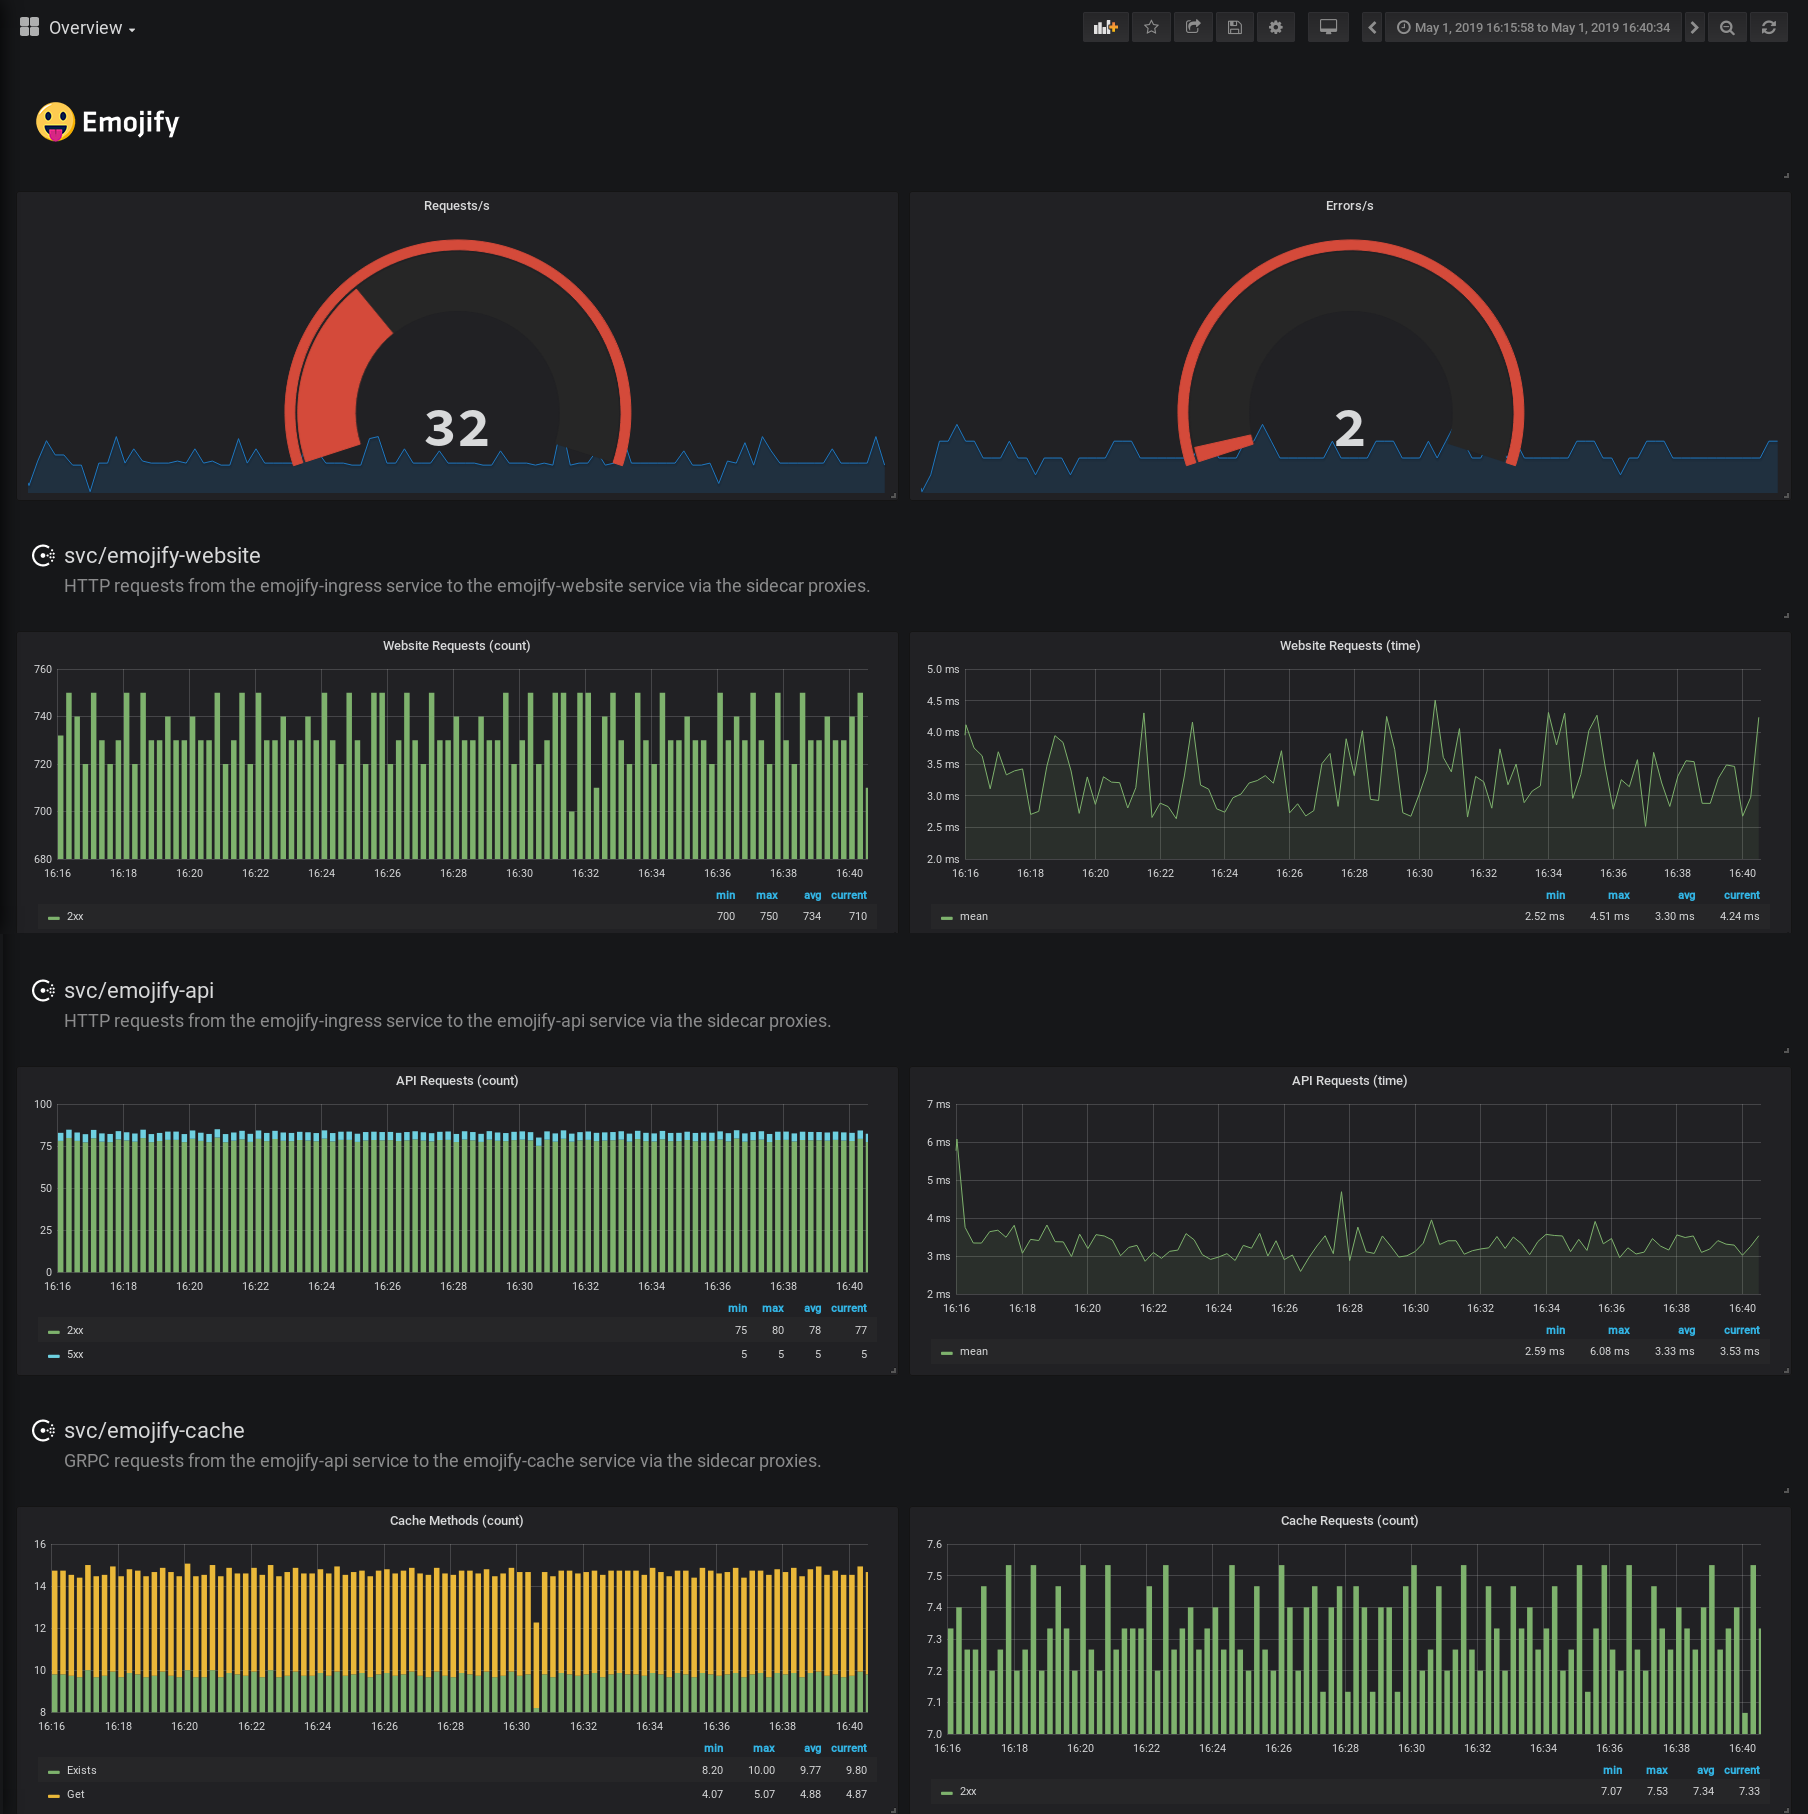 Grafana dashboard containing Envoy metrics
»L7 Observability
By default Envoy proxies connections at L4 or the TCP layer. While that may be useful, it doesn't include important protocol specific information like request rates and response codes needed to indicate errors.
For example, with L4 you will see number of connections and bytes sent and received, but a failure is only going to be reported if a connection is terminated unexpectedly. When your APIs or websites are reporting failures they will generally respond with protocol-specific error messages while keeping the TCP connection alive or closing it gracefully. For example an HTTP service's response carries with it a status code which indicates the nature of the response. You will return a status 200 when a request is successful, a 404 if something is not found, and 5xx when the service has an unexpected error. Envoy can be configured to record which class each response's status falls into to allow monitoring error rates.
Another emerging protocol being used for communication between services is gRPC, which uses HTTP/2 for transport, and Protocol Buffers as an interface definition and serialisation format, to execute remote procedure calls. When configuring Envoy for GRPC, the metrics emitted will provide you with the functions called and the resulting statuses of those calls.
Monitoring these codes is essential to understanding your application, however, you need to enable some additional configuration in Envoy so that it understands that your app is talking L7.
You can specify the protocol of the service by setting the service defaults in a config file (see an example below).
kind: "service-defaults"
name: "emojify-api"
protocol = "http"
And then write it to the centralized configuration with the consul write <filename> command.
If the protocol is “http”, "http2" or “grpc”, it will cause the listener to emit L7 metrics. When bootstrapping the Envoy proxy, Consul will try to resolve the protocol for an upstream from the service it is referencing. If it is defined, there is no need to specify the protocol on the upstream.
Once the protocol fields of the proxy and upstreams are specified or discovered through Consul, Envoy will configure the clusters to emit additional L7 metrics, the HTTP category and HTTP/GRPC subcategories of metrics.
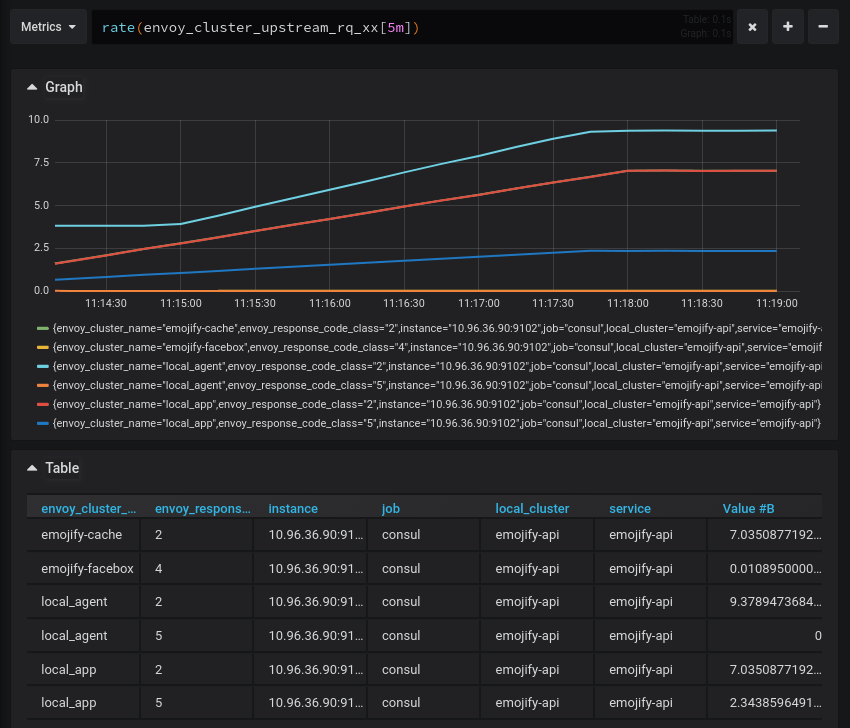 The emojify-cache and emojify-facebox clusters are emitting response codes with their metrics
Once you get L7 metrics in Grafana, you can start to correlate events more precisely and see how failures in the system bubble up.
For example, if the emojify-api upstream starts to return 5xx response codes, you can look at the calls to the emojify-cache service and see if the Get calls are failing as well.
# Number of requests to the emojify-upstream,
# categorized by resulting response code
sum(increase(envoy_cluster_upstream_rq_xx{envoy_cluster_name="emojify-api"}[30s])) by (envoy_response_code_class)

# Number of retry attempts to the emojify-api upstream
sum(increase(envoy_cluster_upstream_rq_retry{envoy_cluster_name="emojify-api"}[30s]))
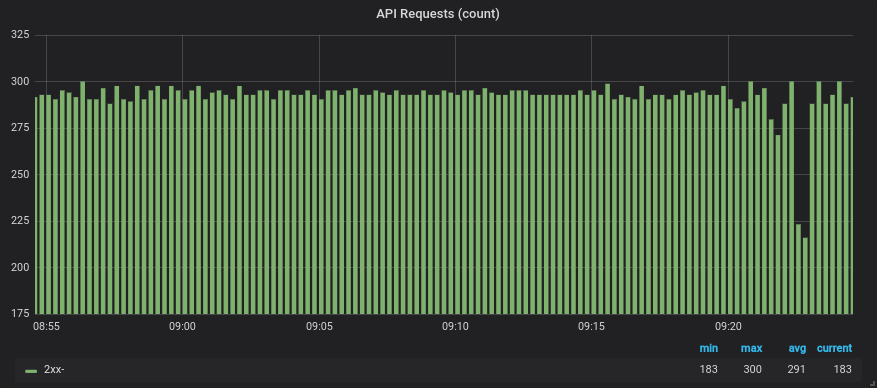 Resulting graph showing the number of requests and retries
# Number of GRPC calls to the emojify-cache upstream,
# categorized by function called
sum(increase(envoy_cluster_grpc_0{envoy_cluster_name="emojify-cache"}[30s])) by (envoy_grpc_bridge_method)
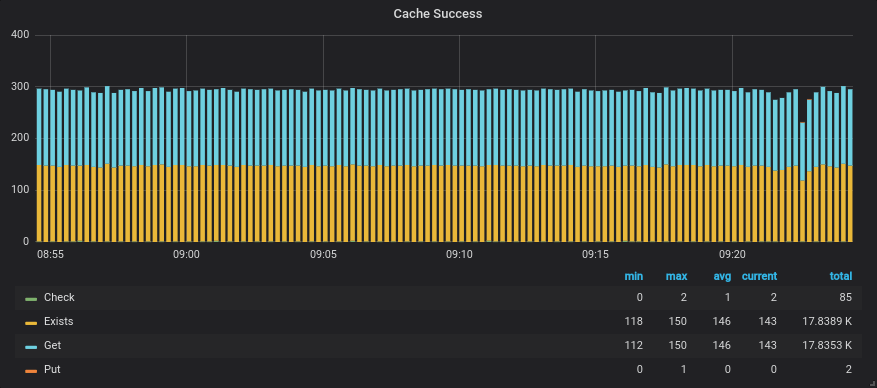 Resulting graph showing the GRPC functions and their call count
You can get much better observability over your systems by using distributed tracing. This requires some cooperation from applications to instigate the tracing and propagate trace context through service calls. The service mesh can be configured to integrate and add spans to traces to give insight into the time spent in the proxy. This can be provided through the envoy_tracing_json field, which accepts an Envoy tracing config in JSON format.
»Summary
By using the centralized configuration you can configure metrics collection for all your services at the same time and in a central location. L7 metrics give you deeper insight into the behavior and performance of your services.
The L7 observability features described here were released in Consul 1.5. If you want to try out the new features yourself, this demo provides a guided, no-install playground to experiment. If you want to learn more about L7 observability for Consul Connect on Kubernetes, take a look at the HashiCorp Learn guide on the subject.

