Operational visibility has never been more critical, especially as Terraform organizations continue to grow, with multiple teams collaborating and run operations now being executed in three different modes. The recent release of the Business tier for HashiCorp Terraform Cloud introduced several enterprise-class features, including Single sign-on (SSO), self-hosted agents, and audit logging capabilities. Audit logging adds that additional level of visibility, as well as accountability.
»Audit Logging
Terraform Cloud’s Business tier presents a new API service by the name of Audit Trails. This JSON-based API service opens the ability to retrieve audit events for the entire organization. From speculative plans to cost estimation, Sentinel policy as code checks to token creations, the Audit Trails API service will log the events and make them available for consumption. The only requirement is an organization token. There are no firewall rules required, meaning that any service equipped with internet access and the organization token can retrieve these logs.
We can even retrieve logs through the following sample cURL command:
curl --request GET \
--url https://app.terraform.io/api/v2/organization/audit-trail \
--header 'authorization: Bearer $TOKEN’
The response is a paginated, JSON formatted history of events for the previous 14 days. These logs also follow the same formatting as Nomad’s Audit Logging, which adds consistency and a layer of transferable knowledge when querying logs and generating reports.
A sample output from the Terraform Cloud Audit Trails service:
{
    "resource": {
        "action": "create",
        "meta": null,
        "type": "run",
        "id": "run-AoU1ugSPwhUkcpjh"
    },
    "request": {
        "id": "db9ce4eb-3ee1-d050-fded-2bcb0fe770c3"
    },
    "auth": {
        "impersonator_id": null,
        "type": "Client",
        "accessor_id": "user-6Pkkj4pCRnSytjLn",
        "description": "kruddy",
        "organization_id": "org-p4vAhDiDffRNhmYw"
    },
    "timestamp": "2020-09-04T14:53:49.000Z",
    "version": "0",
    "type": "Resource",
    "id": "d19372fa-0c21-4c6a-b6b1-0f5650d55b54"
}
»Terraform Cloud for Splunk App
Every time logging is discussed, the first comment is around different integration points. Most organizations already have a centralized logging utility, in some form or fashion. Also, most organizations do not want to duplicate efforts between what they currently have and what they will have to use. To help address this, we have worked with Splunk to create the Terraform Cloud for Splunk app!
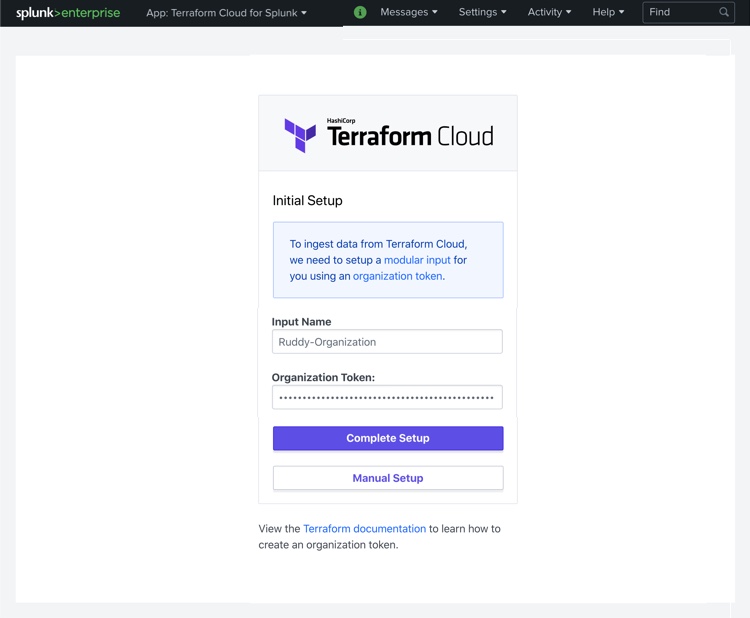
The Terraform Cloud for Splunk app is now available in Splunkbase. The app is compatible for use with both Splunk Cloud and Splunk Enterprise. The installation and configuration process is simple and straightforward. All we need to do is install the app, supply an input name and the organization token from Terraform Cloud. Splunk and Terraform Cloud will then work together to start pulling in those log events immediately.
»Installation - Terraform Provider for Splunk
There are numerous ways to install the Terraform Cloud for Splunk app. There’s the built-in app browser. We can also download the app directly from Splunkbase and place it in the appropriate directory. However, there’s a brand new Terraform provider for Splunk, which is now available on the Terraform Registry. One of the resources we can deploy with this new provider just so happens to be an app!
For the following sample Terraform configuration, we will need to download the Terraform Cloud for Splunk app from Splunkbase and place it in a directory where the Splunk instance can access.
terraform {
  required_providers {
    splunk = {
      source  = "splunk/splunk"
      version = "1.0.0"
    }
  }
}

provider "splunk" {
  url                  = "splunk01.corp.local:8089"
  username             = "user"
  password             = "password"
}

resource "splunk_apps_local" "terraform_splunk_app" {
  filename         = true
  name             = "/tmp/terraform-cloud-for-splunk_005.tgz"
  explicit_appname = "terraform_cloud_for_splunk"
}

The output should look like the following:
------------------------------------------------------------------------

An execution plan has been generated and is shown below.
Resource actions are indicated with the following symbols:
  + create

Terraform will perform the following actions:

  # splunk_apps_local.terraform_splunk_app will be created
  + resource "splunk_apps_local" "terraform_splunk_app" {
      + author           = (known after apply)
      + configured       = (known after apply)
      + description      = (known after apply)
      + explicit_appname = "terraform_cloud_for_splunk"
      + filename         = true
      + id               = (known after apply)
      + label            = (known after apply)
      + name             = "/tmp/terraform-cloud-for-splunk_005.tgz"
      + version          = (known after apply)
      + visible          = (known after apply)

      + acl {
          + app              = (known after apply)
          + can_change_perms = (known after apply)
          + can_share_app    = (known after apply)
          + can_share_global = (known after apply)
          + can_share_user   = (known after apply)
          + can_write        = (known after apply)
          + owner            = (known after apply)
          + read             = (known after apply)
          + removable        = (known after apply)
          + sharing          = (known after apply)
          + write            = (known after apply)
        }
    }

Plan: 1 to add, 0 to change, 0 to destroy.

------------------------------------------------------------------------
Once the app is installed, and the standard restart process has been completed, we need to walk through the initial setup process of adding an input name and organization token. For the input name, we would recommend using the organization name. The organization token can be generated from within the Terraform Cloud organization’s settings, then in the API Tokens section.

»Usage
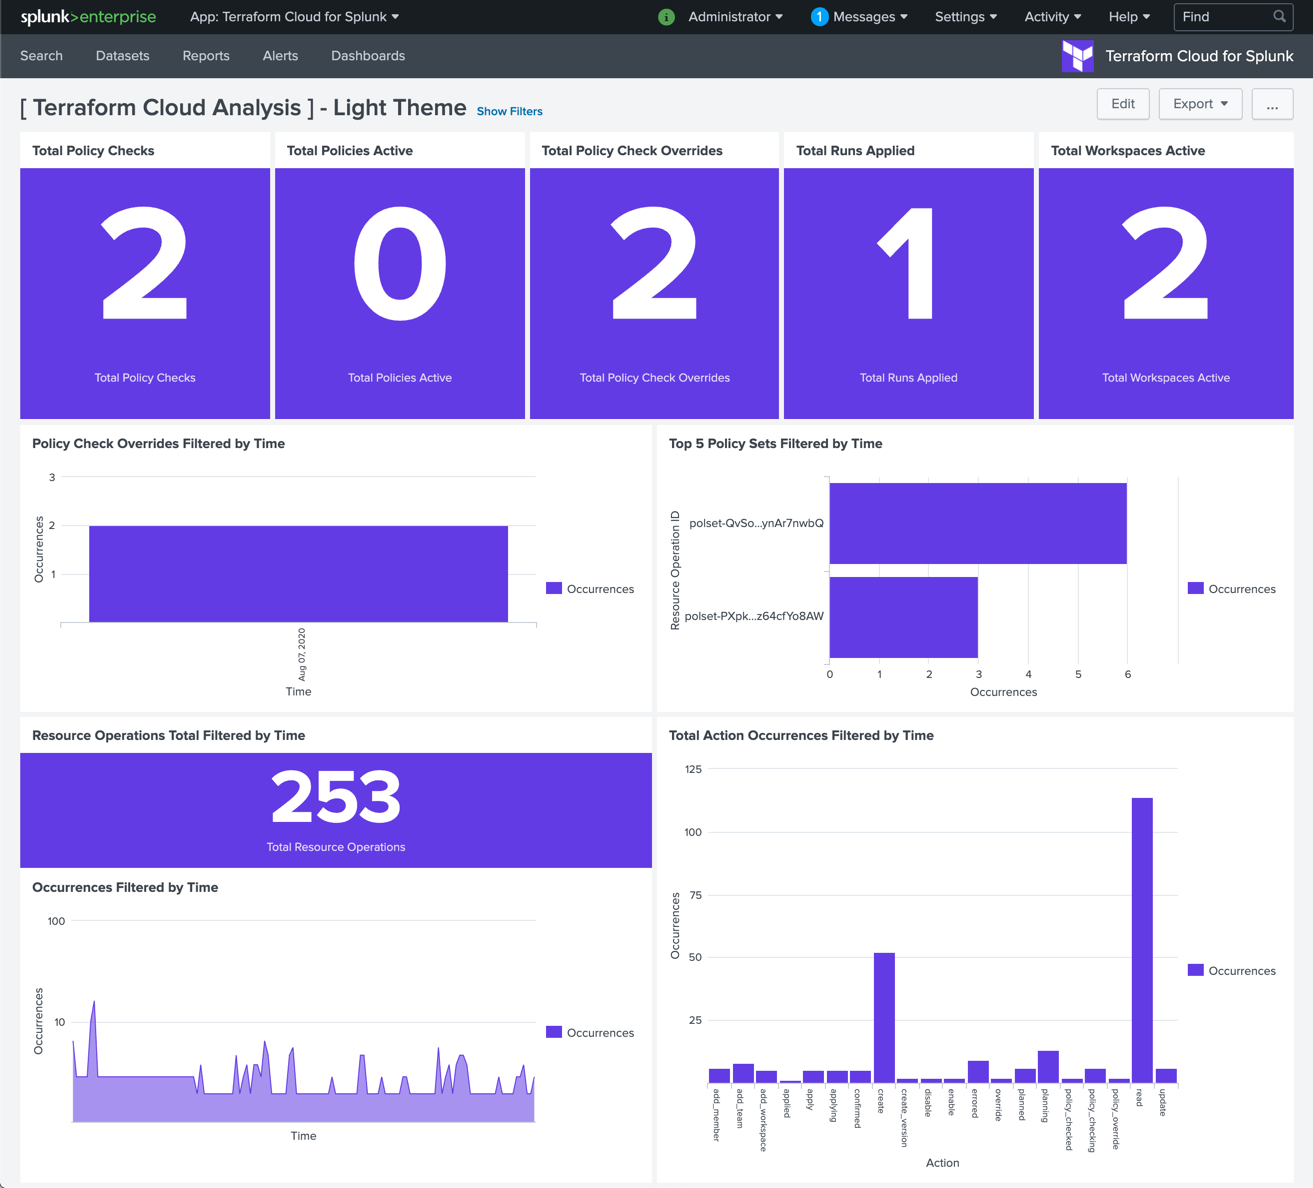
After completing the setup, logs should start to be ingested almost immediately. Data will then regularly be pulled into Splunk where the app provides near real-time visibility into key actions. You can quickly see which workspaces generate the most frequent changes, which Sentinel policies are being evaluated most frequently, and which users are most active. For more in-depth analysis, you can then filter by a number of attributes to inspect individual events.
Several dashboards have been preconfigured to display some essential data tables within the Splunk interface:

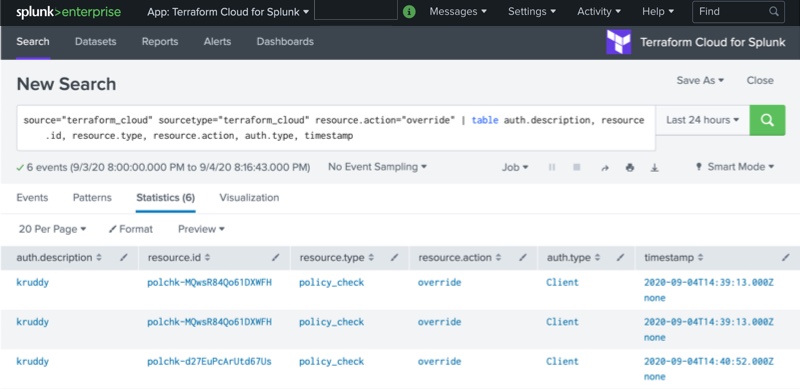
We can also search through the audit logs by using search queries. A particularly interesting search query might be to source the events where a Sentinel policy check was overridden.
The following is a query string which can identify instances where the Sentinel policy check was overridden, by who, when, and against which resource:
source="terraform_cloud" sourcetype="terraform_cloud" resource.action="override" | table auth.description, resource.id, resource.type, resource.action, auth.type, timestamp

»Summary
Terraform Cloud’s Business tier was recently released and came with a number of enterprise-grade features. One of the notable features was around audit logging. This new feature gives the ability to gain visibility across an entire Terraform organization to have a historical record of exactly what is happening. As part of this release, we have teamed up with Splunk to release an app to integrate Terraform Cloud’s audit logging with customers’ existing Splunk Cloud or Splunk Enterprise implementations.
Terraform Cloud is free to get started, and organizations can upgrade to the Team and Governance or the Business tier at any time. To get started, sign-up for Terraform Cloud and follow our Get Started tutorial or contact HashiCorp Sales.
Visit Splunkbase for more information about the Terraform Cloud for Splunk app.
Visit the Terraform Registry for more information about the newly released providers for Splunk and VictorOps.


