Service Mesh at Global Scale
HashiCorp Consul updates 10,000 nodes and 172,000+ services in under 1 second.

»Intro
A service mesh consists of a control plane and a data plane. This helps separate the performance-sensitive data path from the rest of the system. The control plane is responsible for maintaining a global state, coordinating traffic, and configuring the data plane which can be software proxies or hardware appliances. The control plane in a service mesh requires it to be highly available and fault tolerant. To test the control plane scalability of HashiCorp Consul, we’ve constructed a large scale benchmark.
Consul can run a large number of applications at scale on various runtime environments and the benchmark is meant to exercise those capabilities. We partnered with our friends at Amazon Web Services, who provided the compute credits, and Datadog who provided us with the metrics, and visualization support for this experiment.
The key result shows that 5 Consul servers were able to deliver control plane updates to 172,000+ service instances (containers) in under 1 second in a Consul cluster of 10,000 virtual machines.
Thank you to AWS and Datadog for partnering with us on this and providing the credits and support to run this experiment. Below, we go into detail on the experimental setup and the results.
»Experiment Setup
The benchmark infrastructure was set up using HashiCorp Terraform.
The configuration and scripts required to run the benchmark can be found on GitHub.
»Infrastructure
The benchmark infrastructure consisted of the following:
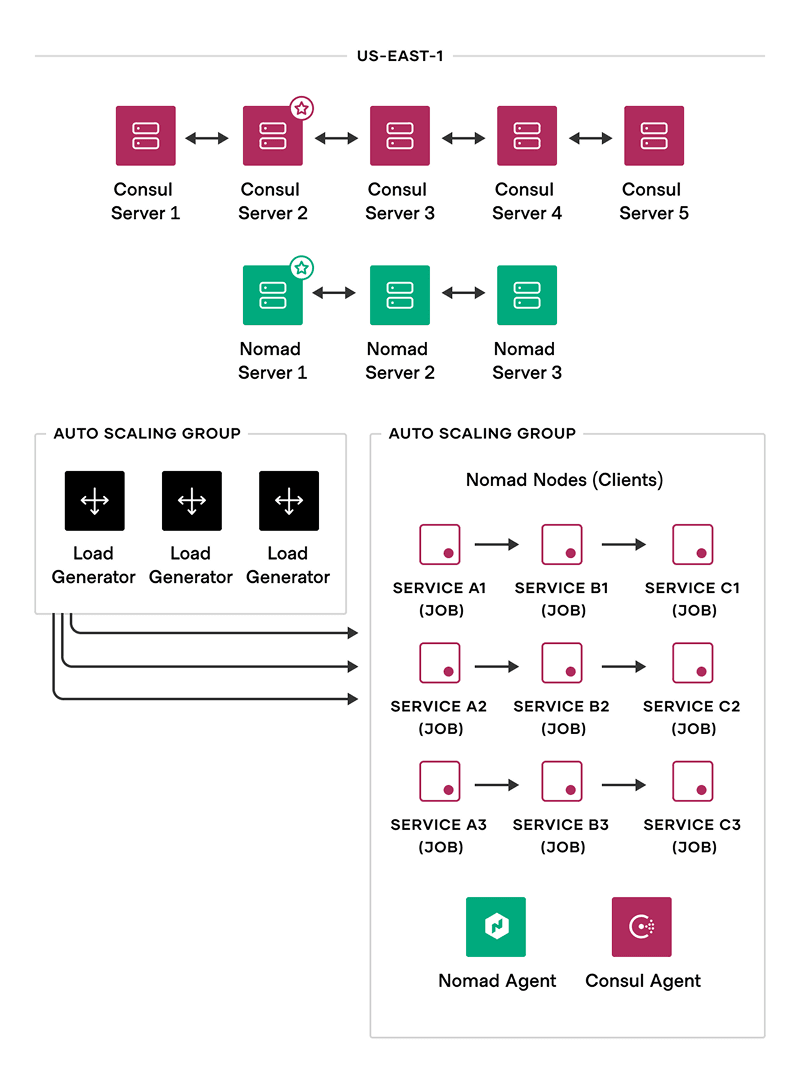
5 Consul Servers (Service Mesh Control Plane): There were 5 Consul servers spread across 3 availability zones (AZs) in us-east-1. Consul servers are responsible for operations that are compute-intensive such as configuring the data plane (Envoy proxies) with service discovery data, generating certificates for mTLS, authorization, and traffic routing data. They also require low latency disk writes as these servers store state. The Consul servers were running on c5d.9xlarge instance type on EC2 which has 36 vCPUs and 72 Gigabytes of memory.
3 Nomad Servers (Scheduler): There were 3 Nomad servers spread across 3 availability zones (AZs) in us-east-1. Nomad servers are responsible for scheduling workloads across nodes in the cluster. They were running on r5d.4xlarge instance type on EC2 with 16 vCPUs and 128 Gigabytes of memory.
10,000 Nomad Clients (Nodes) and Consul Clients: There were 2 auto scaling groups running 5000 EC2 instances each spread across 3 AZs in us-east-1. These instances were running the Nomad client, Consul client, and the workloads in Docker containers. We chose c5.xlarge instance type for the Nomad nodes with 4 vCPUs and 8 Gigabytes of memory.
~100 Load Generators: There was 1 auto scaling group running about 100 load generators spread across 3 AZs in us-east-1. These instances were running Buoyant’s slow_cooker, NGINX server, and Consul client. We chose c5.large instance type for the load generators as they have adequate CPU and network performance. The load generators had 2 vCPUs, 4 Gigabytes of memory, and up to 10 Gigabytes of network performance.
All of the metrics and logs were shipped to Datadog using the Datadog agent on all the machines.
Here are the parameters for the experiment:
Consul Version | 1.9.5 |
Service Tiers | 3 (Tier 1, Tier 2, Tier 3) |
Unique Services Per Tier | 1000 |
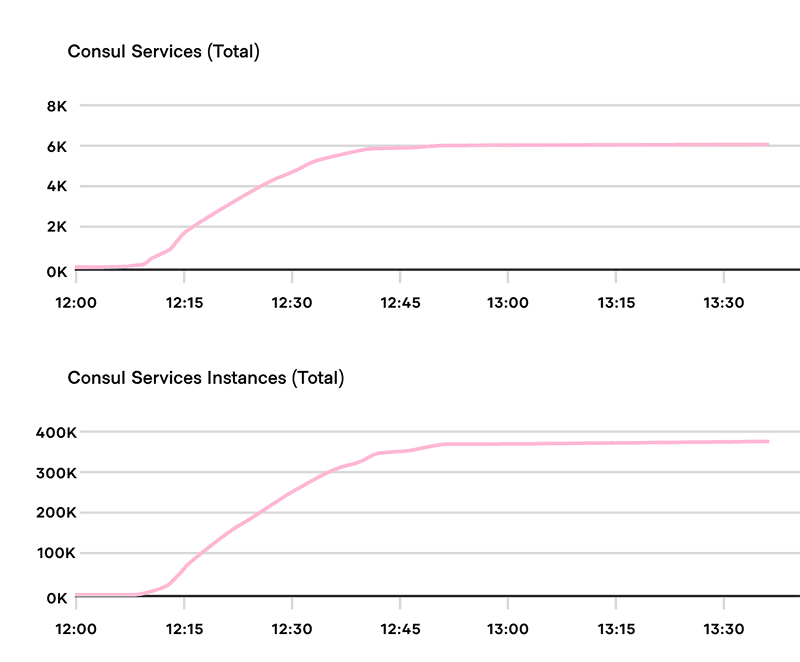
Total Unique Consul Services Registered | 1000 x 3 = 3000 |
Total Consul Services Registered (including the sidecar proxies) | 3000 x 2 = 6000 |
Service Instances (Containers) | Unique Service Per Tier x (Tier 1 Service Instance Count + Tier 2 Service Instance Count + Tier 3 Service Instance Count) = 1000 x (10 + 83 + 85) = 178,000+ |
Service Instances + Sidecar Proxies (Containers) | 178,000 x 2 = 356,000 |
Consul Servers | 5 (c5d.9xlarge Instance Type on EC2) |
Nomad Servers | 3 (r5d.4xlarge Instance Type on EC2) |
Nomad Client Nodes | 10,000 EC2 instances (c5.xlarge Instance Type on EC2) |
Load Generators | ~100 EC2 instances (c5.large Instance Type on EC2) |
AWS Region | us-east-1 |
Below is a diagram to visualize the overall infrastructure setup for the experiment.
»Workload
The workload for this experiment was a really simple Golang application called “fake-service”. The benchmark doesn’t target container performance as one of its goals so we were inclined to keep this portion of the experiment simple by giving minimal CPU and memory to the application. The CPU was set to 500 Mhz and the memory was set to be 50 MB.
The fake-service application allows you to define upstreams dependencies that each application can call and respond with its own and upstream response. This enabled us to create a 3-tier service layout that is closer to a “real-world” microservice scenario. Each service can depend on multiple upstreams and create an N-tier architecture.
»Service Layout
Below is a diagram showcasing the 3-tier architecture that was used in the experiment.

There were 1,000 unique services in each of the 3 tiers totalling up to 3,000 unique services in the cluster. Each service had multiple service instances running in the cluster. Here are the total number of instances in each tier.
Service A (Tier 1): Unique Service Count x Tier 1 Service Instance Count = 1,000 x 10 = 10,000
Service B (Tier 2): Unique Service Count x Tier 2 Service Instance Count = 1,000 x 83 = 83,000
Service C (Tier 3): Unique Service Count x Tier 3 Service Instance Count = 1,000 x 85 = 85,000
Total service instances (containers) in the cluster = 10,000 + 83,000 + 85,000 = 178,000 Each of the service instances had an Envoy sidecar container running alongside them. Both the service application instances and the Envoy sidecar were registered with Consul. The number of instances per service were selected to maximize the utilization of the cluster.
»Scale Up
The scaling up process for an experiment of this magnitude can be tricky as there are many moving parts. HashiCorp Terraform is used to bootstrap the infrastructure and the workloads for this experiment. The networking resources such as the VPC, subnets, etc. were created first. The control plane which is the Consul servers is created next and allowed to become healthy. To bring up 10,000 nodes and have them running is expensive, the goal was to use as much of the billing cycle as possible. Nomad allows jobs to be queued when there is insufficient capacity, this enables us to submit the full set of workloads and then bring up the nodes gradually. Nomad then handles scheduling the workload when a node is registered and capacity is available.
First, all of the approximately 178,000 allocations were submitted to Nomad where the jobs go into “pending” state. We then created two auto scaling groups of 5000 nodes each of which scaled in a matter of minutes which got us to our desired capacity sooner and led to making testing easier. Each node has a random delay on boot up to 26 minutes before the Consul or the Nomad agents come online to prevent overloading of the system. Given that experiments of this scale incur a large cost on each run, the goal was to maximize the chance of success with each run. We prioritized the stability of the infrastructure over total provisioning time as a result. We’ve previously benchmarked how fast workloads could be scheduled with the Nomad C1M and C2M challenges.

It took about 51 minutes for all 10,000 nodes to become available
It took about 46 minutes for all of the workloads to get scheduled on about 10,000 nodes.
Each node on boot would request a TLS certificate to secure communication between the Consul clients and the server. This is done using the auto_encrypt configuration in Consul that allows servers to distribute client certificates automatically. Each time a node joins the Consul cluster, the servers would have to handle a certificate signing request.
Once the Consul client is bootstrapped, the Nomad agent running on the node would register the node in the Nomad cluster. The node would get the set of allocations it needs to run from the Nomad servers. We were using the “spread” scheduling algorithm to schedule workloads evenly in the Nomad cluster. This allowed us to schedule workloads on almost all of the 10,000 nodes that would come online. To learn more about scheduling in Nomad, check out the Scheduling section in Nomad’s documentation website.
Since all the workloads needed to be part of the service mesh, for each allocation that would come online, Nomad would inject an Envoy proxy sidecar alongside it. The allocation would have the fake-service application and the Envoy proxy running in Docker containers. Each of these services would need unique identities in order to communicate with other services in the service mesh. These are assigned using TLS certificates. Each Envoy proxy requests a certificate from the local Consul client running locally on the node. The application and the Envoy proxy health checks are then registered with their local Consul clients. At this scale, there are a large number of nodes and applications coming online at once that need certificate generation and service registration operations to be performed by the Consul servers. By default, Consul sets a max to 50 per second on certificate signing requests. At this scale, we disabled the rate limit by setting csr max per_second to 0 and instead used csr max concurrent value of 12 which allows 12 cores out of 36 to process certificate signing requests. Here is the average smoothed CPU usage of all Consul servers during scale up.
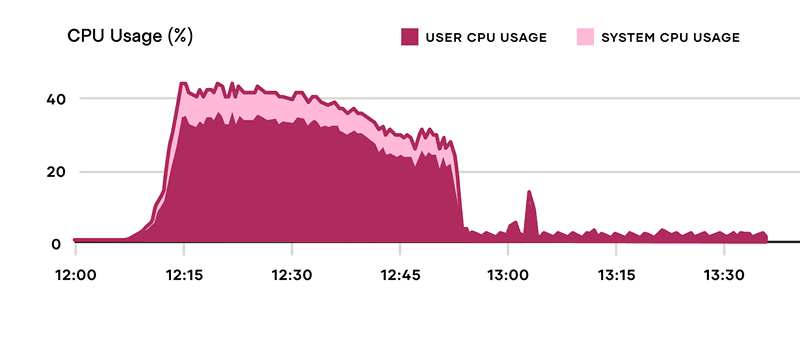
At this level of smoothing, we can see that the Consul servers were busiest with 45.2% CPU usage for about a minute. You will notice that the CPU usage drops off when all the nodes and workloads have been registered with Consul and the cluster is in steady-state.
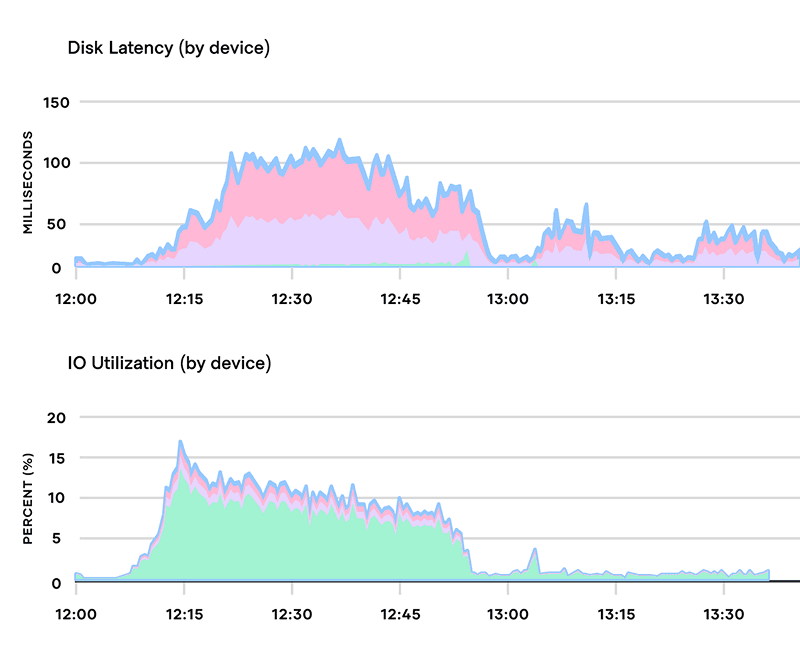
All cluster state is persistent on disk using Raft to ensure consistent state even if the Consul servers go down. At peak, the Consul servers did ~4,000 Raft transactions per second. Here are the disk latency and IO utilization graphs for the Consul servers.
The graph below shows the sum of all memory utilization of the 5 Consul servers each with 72 Gigabytes of memory.
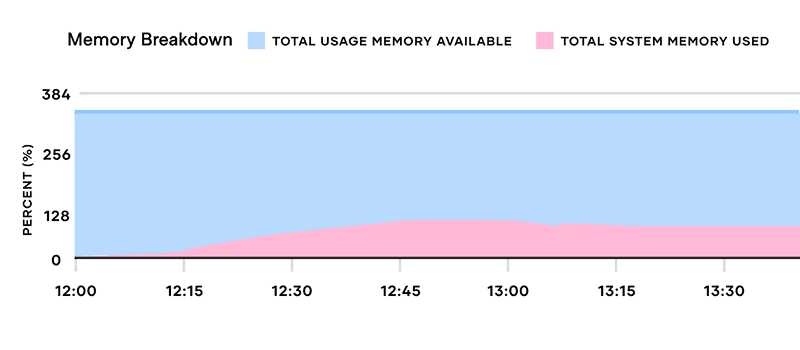
The Consul servers primarily use memory for service state and client connection management. During the scaling up process of the benchmark the memory grows to about ~19-20 Gigabytes in total amongst all Consul servers. It stays constant afterwards. The memory is used to manage thousands of connections, and tens of thousands of gRPC streams - each of those has several goroutines, connection state data and buffers. The slight peak towards the end of the scaling up process is caused by the additional memory being consumed by snapshot delivery which then is freed once all the streams are connected and no snapshots are being requested by the Consul agents running in the cluster.
»Results
The main goals of the Consul benchmark is to showcase the control plane responsiveness of Consul: when there are a large number of nodes and services in the Consul cluster, how long does it take for the Consul servers to propagate a change in the cluster state to all Envoy proxies.
Each of the 178,000 service instances that were running in the cluster were watching a single, common upstream service. If that upstream service changed in the Consul catalog that would trigger an update in the configuration across all the 178,000 Envoy sidecar proxies.
In order to measure the propagation time, we ran two types of tests.
Endpoint Propagation: The time it takes to propagate a service catalog change to all services running in the cluster. This is a common update, as services are deployed, scaled up and down, or have changes in their health status.
Intention Propagation: The time it takes to propagate an intention rule change to all Consul clients running in the cluster. This is a less common update, but can be critical for changes in security policies or service to service authorizations.
»Endpoint Propagation
When a service instance is registered or deregistered in the Consul catalog, all proxies that need to consume that service as an upstream dependency must be updated. Envoy uses its own protocol, known as xDS, to stream updates from the local Consul agent on each node. Each Consul agent must watch for changes in the set of healthy instances for all upstream services on the Consul servers. As of Consul 1.9, they can optionally do this via a new mechanism called "streaming" that was used in this experiment. Streaming will be the default mechanism for service discovery in a future major release.
Streaming ensures that when a service instance is updated, all interested agents are sent a copy of the event (either registration or deregistration) so they can update proxy configurations for all local proxies registered to them. The agent uses the event to reconstruct it's local view of the service instances available and then reconfigures Envoy with the latest information via xDS.
»Coalesce Timeout
An important detail is that Consul uses a coalesce timeout to batch updates to Envoy. Each proxy must watch for several, perhaps hundreds of separate resources in Consul. It's common for multiple of those resources to change at once, especially when the proxy first comes up and makes many parallel requests. If Consul simply updated the whole proxy configuration every time anyone resource changed, it would end up queuing up many reconfigurations on top of each other which might mean that it takes longer to apply them or cause more disruption to traffic if they have to drain connections. This can also happen during a deployment where the sets of instances change along with the configuration resources for a service or multiple services at once.
To avoid reconfiguring Envoy multiple times in a row, the Consul agent's wait for 200ms after the first change in a while to see if anything else is going to change too so we can deliver a single config update to the sidecar. 200ms is short enough that it's unlikely to be a noticeable propagation delay for normal changes, but it's enough to reduce the number of proxy configuration updates in common cases like during proxy startup. The 200ms delay is a normal part of operation and uniform on every update of the Envoy sidecar proxy. In the benchmark, we observed that this timing was almost always 200ms with the exception of a few scenarios where we saw Consul agents or the Envoy proxies see events earlier. This could be possible for nodes in the cluster that had already received an update and we’re already in a 200ms timer window during the event that was being measured came in, and hence the changes are propagated faster. There could also be clock skew in measuring the propagation timings.
»Service De-registration Test
We wanted to model a scenario where a service deregisters itself due to a node that the service is running on being taken down for maintenance or service failing its health checks. We chose to deregister a common upstream service that all of about 178,000 downstream services were watching and measure the propagation time for the change in Consul catalog.
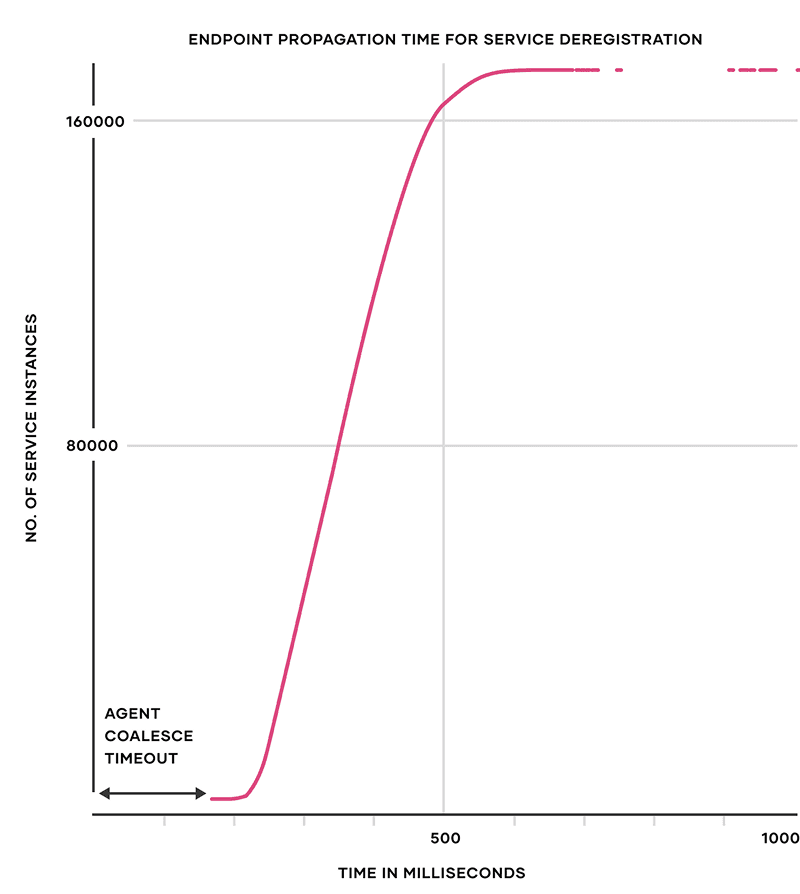
The above graph shows the endpoint propagation time of removal of an upstream service that causes an update in envoy proxy configuration of approximately 172,000 service instances (~96.6% of the total service instances) in under 1 second. The X-axis is the propagation time in milliseconds and the Y-axis is the number of service instances (envoy proxies).
Please note the following:
The graph has the timing of the coalesce timeout included in the results and is discussed above in the report.
The results in the graph are truncated at one second for legibility.
Here are the results for endpoint propagation time for approximately 178,000 service instances.
p50 | 361.0 ms |
p75 | 425.9 ms |
p90 | 485.0 ms |
p95 | 535.0 ms |
p96 | 564.2 ms |
p97 | 4287.9 ms (4.3 s) |
p98 | 15557.9 ms (15.6 s) |
p99 | 32051.9 ms (32.1 s) |
The results above exhibit a long-tail of propagation delays. The vast majority of proxies are updated quickly while a smaller fraction take more than a second, with a few taking up to a minute to be updated.
Our initial tests at 5000 node scale showed a significantly worse tail where around 14% of proxies took minutes to be updated with a peak around both 5 and 10 minutes after the event. Through analysis and tracing we were able to identify several bugs in the new streaming implementation that were not visible even in clusters of 2000 nodes. These were fixed before the final test run reported here.
The remaining proxies that received an update later than a few seconds were investigated further by closely examining logs and tracing data between the server and clients. In all of the cases we audited, the cause of the delay appeared to be transient network disturbance:
Both server and client CPU and network resources were carefully checked and found to be well within reasonable levels.
We didn't observe evidence of clients or servers blocking unnecessarily. In general the server sent or attempted to send the message to these affected clients at the same time as other clients (unless they were disconnected).
Some agents saw TCP connections to the servers drop shortly before we triggered the test so the agent was still in a retry-backoff wait and only received the update once it had reconnected and loaded a new snapshot of the service state.
Some agents had failed repeatedly to connect to the servers some minutes earlier apparently due to transient network timeouts, but due to repeated failures were in a backoff state and took a minute or more to reconnect.
Some agents remained connected to the server for the entire duration however the actual message sent took a minute or more to be received. There were no TCP drops or reconnections in these cases so the likely cause was packet loss leading to TCP retransmits - some agents in this state saw delays that were just over 51 or 102 seconds (which correspond to the 8th or 9th default TCP retransmit timings in Linux). Metrics showed a small amount of TCP retransmitted segments on servers and affected client agents.
We couldn't find any evidence to suggest Consul's streaming mechanism was in an unexpected state given the network issues in these cases, however we plan to continue testing Consul to understand if there are ways we can tune gRPC and other connection parameters such as retry timing, keep alives and timeouts to improve delivery at this scale even further.
While we'd like to be able to recover even more quickly from transient network issues and improve this tail at scales where transient network issues are always present, we saw Consul consistently updating all proxies within a minute of network connectivity issues being resolved.
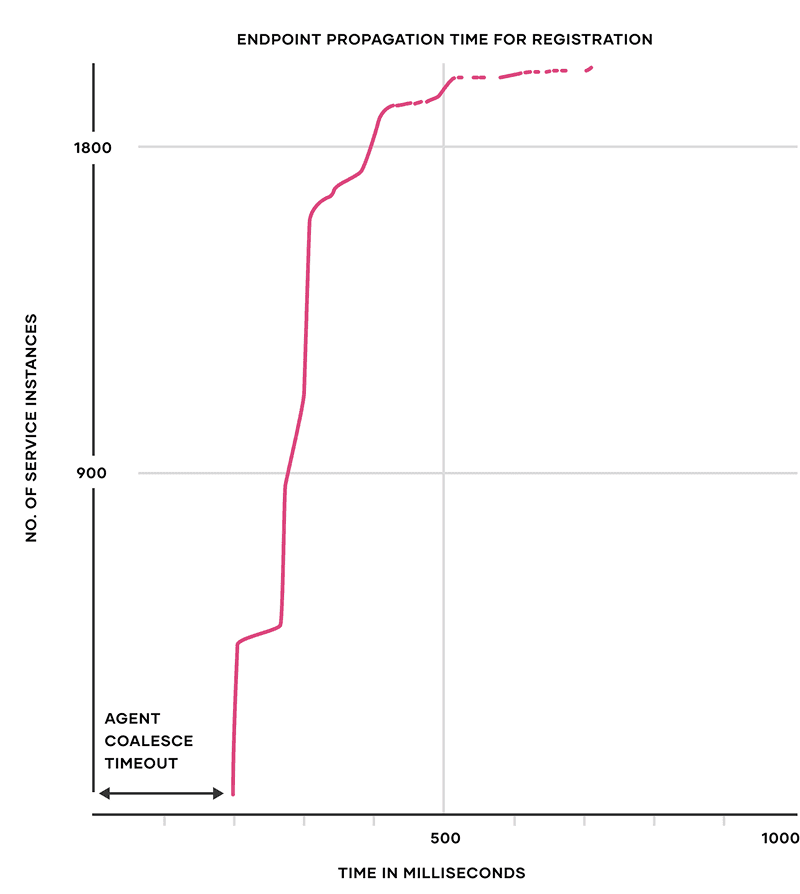
At smaller scales we didn't see this long-tail behaviour at all across multiple test runs. For example at 2000 nodes and 48,000 sidecar proxies we saw all proxies update consistently within 700ms. Below is the graph showing the 2000 nodes endpoint propagation time of a service de-registration.

»Intention Propagation
Intentions in Consul define access permissions for services and policies around traffic shaping. They are used to control which services are allowed to talk to each other, which are translated to Envoy’s RBAC filters for enforcement.
The Consul clients create blocking queries against the Consul servers to watch for any changes to how intentions are configured. Any updates to intentions are made using the Consul API and are then propagated from the Consul servers to the watching Consul clients. The clients then update the Envoy proxy's configuration.
The Envoy proxies are then responsible for performing authorization of connections or requests using their RBAC rule configuration. This helps with the performance of the requests by avoiding IPC or network latency.
»Intention Creation Test
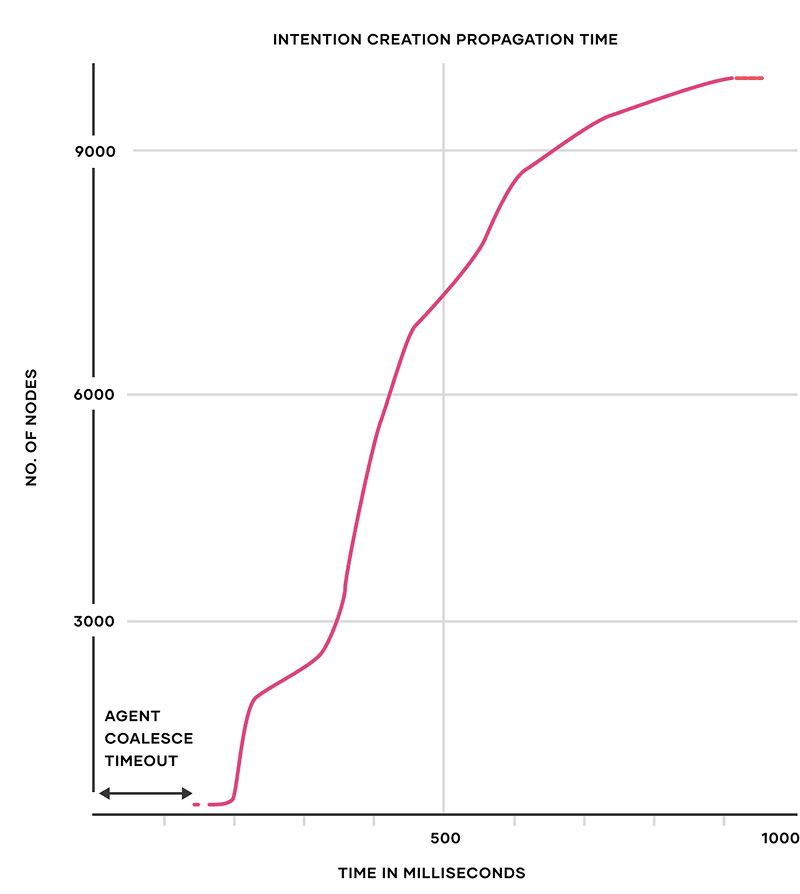
The above graph shows the intention creation propagation time when an intention is created via the Consul API and the time it takes for all Consul client agents to see the creation event. The X-axis is the intention propagation time in milliseconds and Y-axis is the number of nodes. In the test above, there was a wildcard intention rule created to disallow traffic from all services to one service. There were 9996 client nodes that had services running on them that were registered with their local Consul client agent. The intention creation propagated to 9996 nodes in under 900 milliseconds.
p50 | 361.1 ms |
p75 | 493.1 ms |
p90 | 610.3 ms |
p95 | 689.6 ms |
p96 | 715.4 ms |
p97 | 753.2 ms |
p98 | 786.6 ms |
p99 | 815.2 ms |
The results above show the propagation time to Consul agents running on 9996 nodes. The propagation time of the RBAC changes to the Envoy proxies was difficult to infer from the proxy logs. This led to us only measuring the propagation time to the Consul agents instead of the RBAC rules changing in the proxies.
»Data Plane Testing
In this Consul benchmark we explicitly did not focus on testing the Data Plane which in this case is the Envoy proxy. We felt that there are great benchmarks that are published and are out there already. For example, platforms like Meshery can be used to load test Envoy. In the case of our benchmark, the number of load generators required to saturate ~10,000 nodes would be large and expensive.
We did run about 200,000+ requests with a maximum of ~2,700 requests per second through the system using 100 load generators. This was done to validate whether all Envoy proxies were configured correctly. There were no errors found. Here is the latency graph for the period of the test.

»Multi-Platform Testing
Although the Consul Global Scale benchmark used Nomad as its scheduler, the test bench was built to support both Kubernetes and Nomad. This is possible as Consul supports multiple platforms. We ran the endpoint propagation test on Kubernetes.
The benchmark infrastructure for the Kubernetes test consisted of the following:
3 Consul Servers (Service Mesh Control Plane): There were 3 Consul servers spread across 3 availability zones (AZs) in us-west-2. Since this test would only require the control plane to scale for 100s of nodes we chose c5.xlarge instance type for Consul servers on EC2 which has 4 vCPUs and 8 Gigabytes of memory.
500 Kubernetes Workers and Consul Clients: There were 3 auto scaling groups running with 150, 150, and 200 EC2 instances each spread across 3 AZs in us-west-2. We chose c5.xlarge instance type for the Kubernetes workers. Terraform was used to install the Consul Helm Chart on Kubernetes that created daemonsets running the Consul clients.
The result from the tests is as follows.
The above graph shows the endpoint propagation time of adding an upstream service that causes an update in envoy proxy configuration of approximately 1990 service instances (Kubernetes pods) in under ~700 milliseconds. The X-axis is the propagation time in milliseconds and the Y-axis is the number of service instances (envoy proxies).
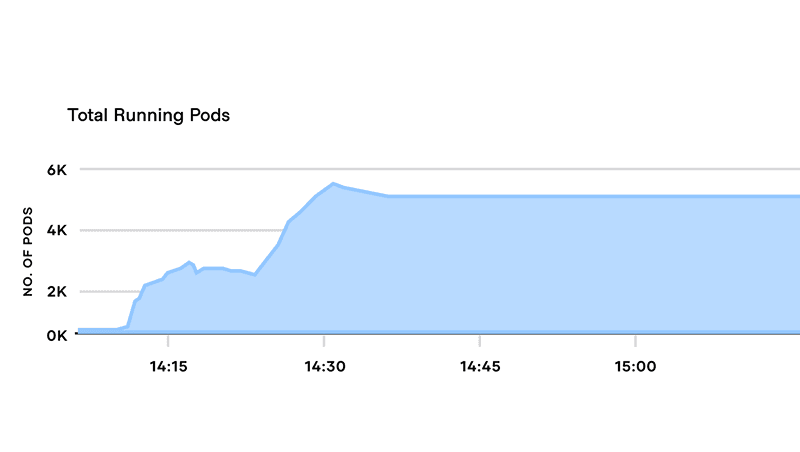
The above graph shows the total number of pods that were running in the 500 node cluster. This includes the fake-service, consul client, Datadog agent, and other pods that are required for cluster management operations such as CNI.
We noticed that even though the auto scaling groups would spin up 1000s of instances in a matter of minutes, it took a substantial amount of time for the Kubernetes workers to become ready to run the workload. This wasn’t ideal in terms of cost and efficiency for the experiment. In order to optimize the scale up time and cost, we decided to run the 10,000 node experiment using HashiCorp Nomad.
»Benchmark Data Collection
A benchmark of this magnitude requires a large number of metrics and log collection. We used the Datadog platform for the Consul Global Scale benchmark. The range of data included the following: * Statsd data for Consul, Nomad, Envoy proxies, Kubernetes, and load generator instances * Logs for Consul, Nomad, Envoy proxies, and fake-service application * APM data for the fake-service application needed to generate service-to-service traces and generate latency graphs
To reach our goal of 10,000 nodes for the benchmark, we had to start smaller (100s and 1000s of nodes) and incrementally build toward the 10,000 nodes goal. There was a large number of metrics and log data that was generated during this benchmark.
Here is the data for the usage of Datadog for this benchmark.
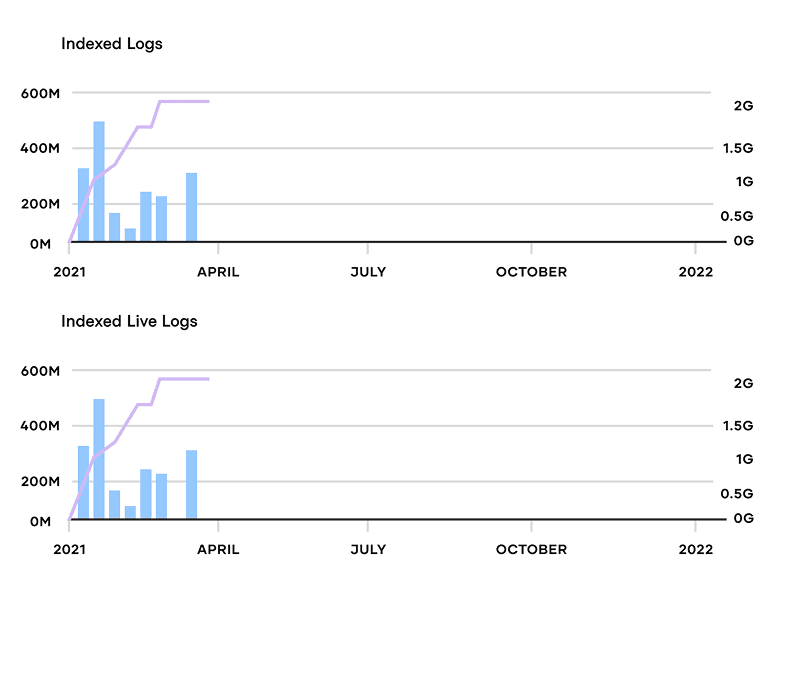
Datadog processed around1.8 billion log events (1,826,688,283)throughout the whole time period we worked on the benchmark.
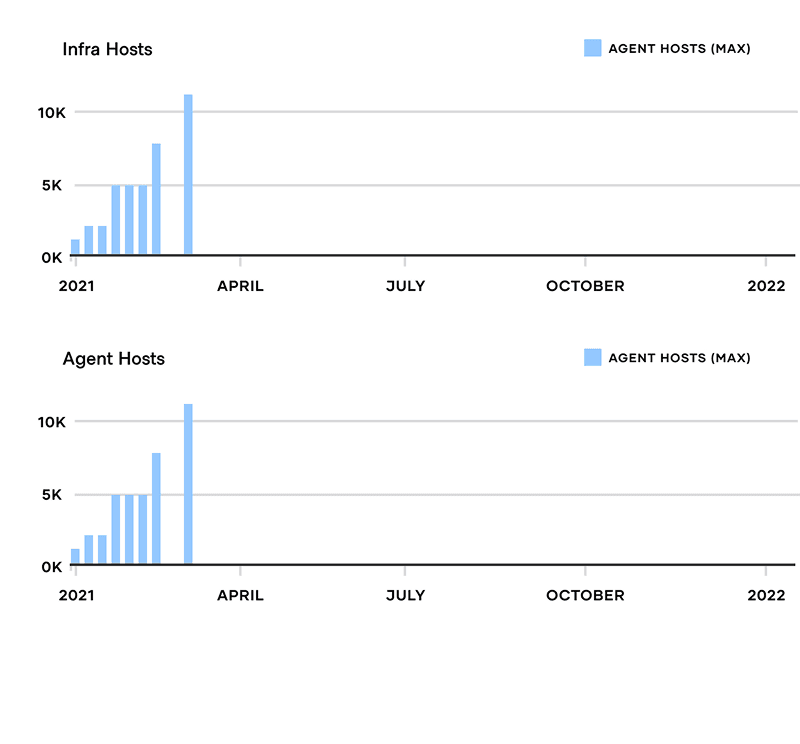
The above graphs show various benchmark runs that were run starting from 1,000 to 10,000 nodes in 2021.
This benchmark required us to support Kubernetes and Nomad platforms that meant our metrics and logging platform needed to support both. The Datadog agent was installed on Kubernetes using the Datadog agent Helm chart and APT package on Nomad nodes running Ubuntu. More details on installing the Datadog agent can be found in the Terraform configuration for the benchmark.
»Conclusion
The Consul Global Scale benchmark showcases our hard work and commitment to designing software that scales with our users. We partnered with two innovative companies in AWS and Datadog to stretch the boundaries of a service mesh control plane. HashiCorp Consul is a service mesh solution that can scale to a very large number of nodes and services, spanning a variety of environments such as Kubernetes, Nomad, virtual machines, bare metal, and more. We look forward to continuing to move the needle with Consul in terms of performance, scalability, and reliability.